
[Reading time: 2 minutes]
Overview
The My Statistics Today tab in the small banner displays your personal daily statistics.

Data is reset every day, giving you an up-to-date view of your activity across all channels. This tab helps agents track their productivity and manage their performance during the day.
1. Layout and Metrics
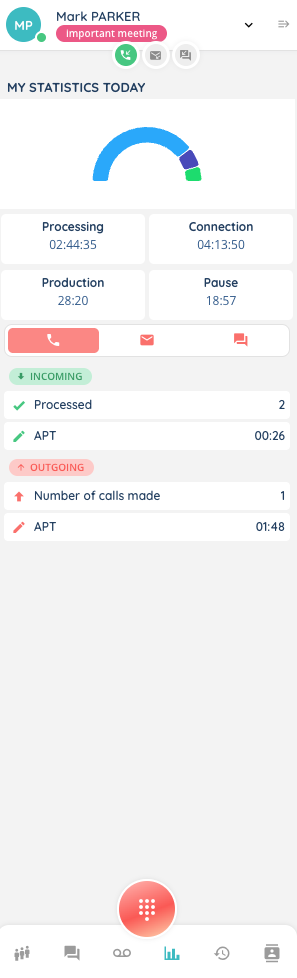
At the top, a half-donut chart shows the distribution of your daily activities based on activity categories:
- Processing – time spent on activities categorized as processing
- Productive unavailability (= Production) – time spent in productive breaks
- Unproductive unavailability (= Pause) – time spent in non-productive breaks
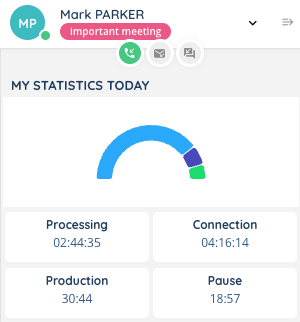
Below the chart, four squares display the total duration in HH:MM:SS format for the following categories:
- Processing – time spent on processing activities
- Connection – total time connected during the day
- Production – productive unavailability
- Pause – non-productive unavailability
Only Smart interactions are taken into account in these statistics.
2. Channel-specific Statistics
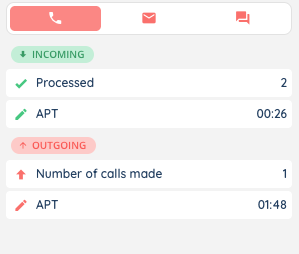
The tab is divided into three channels: Voice, Email, and Messaging. Each channel shows both incoming and outgoing interactions.
Note: APT = Average Processing Time
Voice
- Incoming:
- Processed
- APT
- Outgoing:
- Number of calls made
- APT
- Incoming:
- Processed
- APT
- Outgoing:
- Number of emails sent
- APT
Messaging
- Incoming:
- Processed
- APT
- Outgoing:
- Number of SMS sent
- APT
3. Notes
- If an interaction is currently in progress, it will be displayed above the statistics in the same tab.
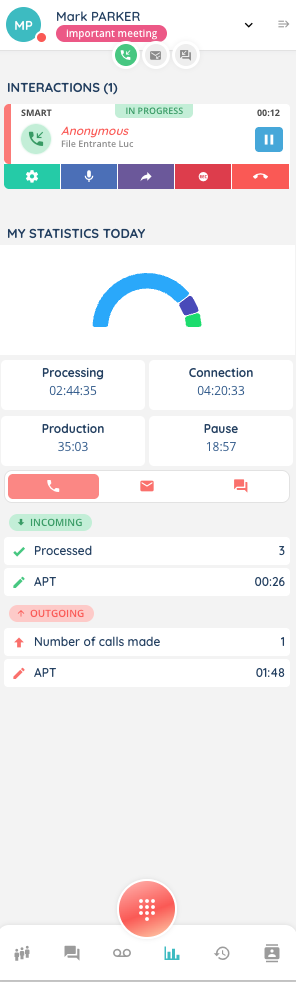
- The four squares (Processing, Connection, Production, Pause) are common across all three channels.