

[Reading time: 15 minutes]
This article is a catalogue: it lists, data source by data source, the KPIs and calculated data provided in advance. It does not explain again what a KPI is or how to create one, as those topics are covered in KPIs in explorations and Calculated data customized (KPI).
Note: the acronyms used in KPI names, such as ATT, AHT, ACW, hold time, QS or SLA, are defined with their formulas in Terms and vocabulary, section Statistics vocabulary.
Overview
When you create an exploration in the Reporter, you do not have to start from a blank page. Every data source comes with templates: ready-made KPIs you can drop straight into your exploration, and calculated data.
This calculated data serves two purposes: it feeds the KPI templates, and you can reuse it to build a KPI that does not exist among the templates. That is why it is listed separately in this article.

You find them when you create an exploration, in its KPIs tab. The calculated data provided appear alongside the ones you create yourself.
Note: KPI templates and calculated data that is provided cannot be edited or deleted. If you need a variant, create your own calculated data or KPI.
1. Prerequisites
- A Smart licence.
- Read rights on data sources and on explorations, granted on your role.
- At least one data source available on your account.
2. How to read the lists in this article
In the interface, the available KPIs are grouped under a heading for each visualisation type. The lists below hold the same content, presented differently: the type is repeated in brackets after each name, so that everything can be read in one go.
- For a KPI, the type is its visualisation, and what follows gives the data that feed it.
- For calculated data, the type is followed by its calculation, then by the column used and its condition if there is one. A formula is written out in full.
Each visualisation type and each data type is explained in the two articles linked in the introduction.
You will come across six visualisation types in the lists: single value square, multi line, pie chart, table, heat map and boxplot. Each one is described in KPIs in explorations, section 1. KPIs types. The four calculated data types, data, data group, formula and boxplot, are described in Calculated data customized (KPI).
3. Using a template
- Open your exploration, then its KPIs tab.
- Click Create a new KPI.
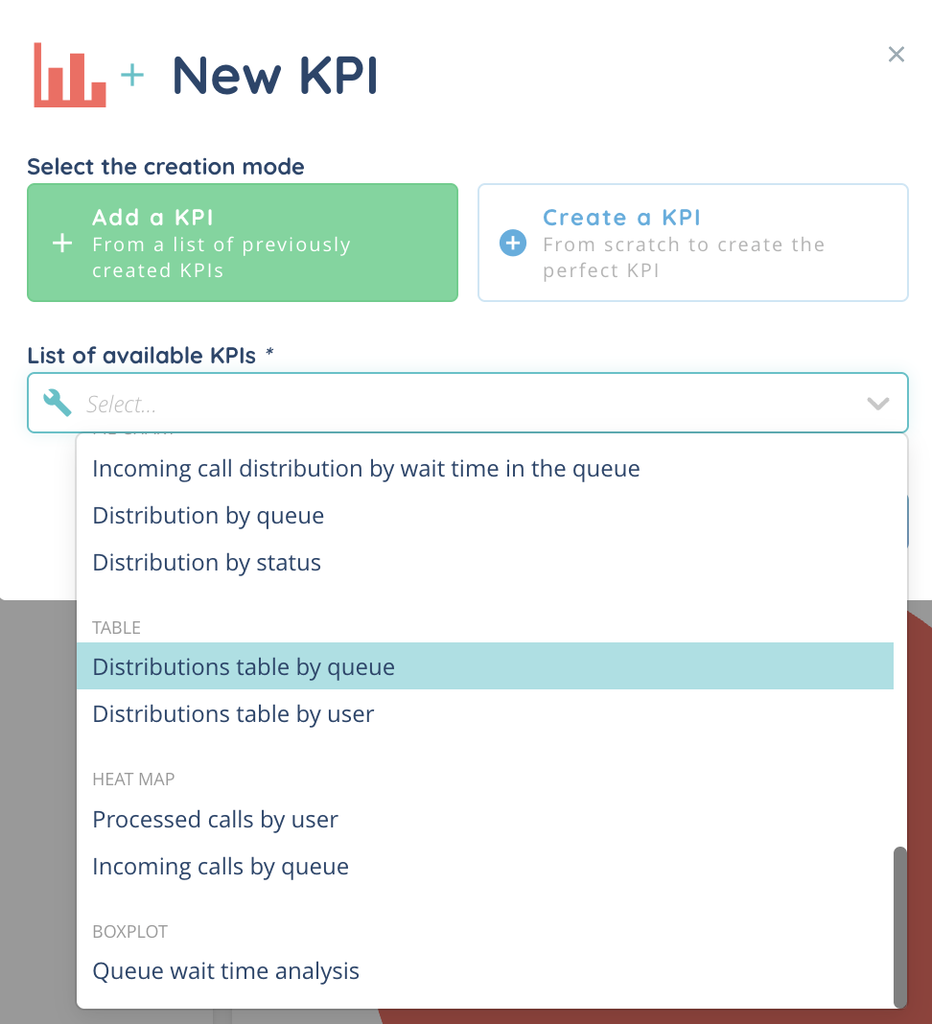
- Under Select the creation mode, keep Add a KPI.
- Open List of available KPIs and pick the one you want. Entries there are grouped by visualisation type.
The KPI is added to your exploration together with the data that feed it. You can then move it around or adjust it.
The other mode, Create a KPI, starts from scratch: that is where you build your own KPI from calculated data, the ones you create as well as the ones provided.
4. Voice flow
Find all the data from your calls
4.1. Incoming calls
KPI templates
Multi line
- Number of handled/abandoned calls by date
- Call date Grouped by “Call date”
- Number of handled calls Count of “Call date” · only if Status = TREATED
- Number of abandoned calls Count of “Call date” · only if Status = CANCELED
- Number of inbound calls by date
- Call date Grouped by “Call date”
- Number of inbound calls Count of “Call date”
- Number of incoming calls/date
- Call date Grouped by “Call date”
- Number of incoming calls Count of “Interaction ID”
Pie chart
- Distribution by smart routing
- Smart Routing Grouped by “Smart Routing name”
- Number of inbound calls Count of “Call date”
- Distribution by status
- Status Grouped by “Status”
- Number of inbound calls Count of “Call date”
- Number of incoming calls/Smart Routing
- Smart Routing Grouped by “Smart Routing name”
- Number of incoming calls Count of “Interaction ID”
Single value square
- Average call duration
Average of “Communication time”, in mm:ss - Number of abandoned calls
Count of “Call date” · only if Status = CANCELED - Number of handled calls
Count of “Call date” · only if Status = TREATED - Number of incoming calls
Count of “Interaction ID” - Number of unique callers
Number of unique values of “Caller number”
Table
- Calls table by status
- Status Grouped by “Status”
- Number of inbound calls Count of “Call date”
- Number of handled calls Count of “Call date” · only if Status = TREATED
- Number of abandoned calls Count of “Call date” · only if Status = CANCELED
- Average call duration Average of “Communication time”, in mm:ss
Calculated data
Data · Average
- Average call duration
Average of “Communication time”, in mm:ss - Average smart routing duration
Average of “Smart Routing time”, in mm:ss
Data · Count
- Number of abandoned calls
Count of “Call date” · only if Status = CANCELED - Number of handled calls
Count of “Call date” · only if Status = TREATED - Number of inbound calls
Count of “Call date” - Number of incoming calls
Count of “Interaction ID”
Data · Number of unique values
- Number of unique callers
Number of unique values of “Caller number”
Data group
- Call date
Grouped by “Call date” - Smart Routing
Grouped by “Smart Routing name” - Status
Grouped by “Status”
4.2. Outgoing calls
KPI templates
Multi line
- Number of outgoing calls/date
- Call date Grouped by “Call date”
- Number of outgoing calls Count of “Interaction ID”
- Number of successful/unsuccessful calls by date
- Call date Grouped by “Call date”
- Number of successful calls Count of “Call date” · only if Status = TREATED
- Number of unsuccessful calls Count of “Call date” · only if Status = ERROR
Pie chart
- Distribution by call type
- Call type Grouped by “Call type”
- Number of outbound calls Count of “Call date”
- Distribution by status
- Status Grouped by “Status”
- Number of outbound calls Count of “Call date”
Single value square
- Average call duration
Average of “Communication time”, in mm:ss - Number of outgoing calls
Count of “Interaction ID” - Number of successful calls
Count of “Call date” · only if Status = TREATED - Number of unsuccessful calls
Count of “Call date” · only if Status = ERROR
Table
- Calls table by status
- Status Grouped by “Status”
- Number of outbound calls Count of “Call date”
- Number of successful calls Count of “Call date” · only if Status = TREATED
- Number of unsuccessful calls Count of “Call date” · only if Status = ERROR
- Average call duration Average of “Communication time”, in mm:ss
Calculated data
Data · Average
- Average call duration
Average of “Communication time”, in mm:ss
Data · Count
- Number of outbound calls
Count of “Call date” - Number of outgoing calls
Count of “Interaction ID” - Number of successful calls
Count of “Call date” · only if Status = TREATED - Number of unsuccessful calls
Count of “Call date” · only if Status = ERROR
Data group
- Call date
Grouped by “Call date” - Call type
Grouped by “Call type” - Status
Grouped by “Status”
4.3. Incoming call distributions
KPI templates
Boxplot
- Queue wait time analysis
- Queues Grouped by “Queue”
- Wait time Min / Q1 / median / Q3 / max bounds on “Wait time”
Heat map
- Incoming calls by queue
- Distribution date Grouped by “Distribution date”
- Queues Grouped by “Queue”
- Number of incoming calls Count of “Distribution date”
- Processed calls by user
- Users Grouped by “User”
- Distribution date Grouped by “Distribution date”
- Number of processed calls Count of “Distribution date” · only if Interaction status = TREATED
Multi line
- Incoming calls by date
- Distribution date Grouped by “Distribution date”
- Number of incoming calls Count of “Distribution date”
- Number of processed calls Count of “Distribution date” · only if Interaction status = TREATED
- Number of aborted calls Count of “Distribution date” · only if Interaction status = CANCELED
- QS (%) “Number of processed calls” ÷ “Number of incoming calls” (in %)
- Incoming calls by queue
- Queues Grouped by “Queue”
- Number of incoming calls Count of “Distribution date”
- Number of processed calls Count of “Distribution date” · only if Interaction status = TREATED
- Number of aborted calls Count of “Distribution date” · only if Interaction status = CANCELED
- QS (%) “Number of processed calls” ÷ “Number of incoming calls” (in %)
- Incoming calls by user
- Users Grouped by “User”
- Number of incoming calls Count of “Distribution date”
- Number of processed calls Count of “Distribution date” · only if Interaction status = TREATED
- Number of aborted calls Count of “Distribution date” · only if Interaction status = CANCELED
- QS (%) “Number of processed calls” ÷ “Number of incoming calls” (in %)
- Number of calls, ATT, ACW, POH and APT / date
- Distribution date Grouped by “Distribution date”
- Number of incoming calls Count of “Distribution date”
- ATT Average of “Communication time”, in mm:ss
- Average post-call time Average of “Post-interaction time”, in mm:ss
- Average hold time Average of “Hold time”, in mm:ss
- Average processing time Average of “Total interaction time”, in mm:ss
- Number of calls, ATT, ACW, POH and APT / queue
- Queues Grouped by “Queue”
- Number of incoming calls Count of “Distribution date”
- ATT Average of “Communication time”, in mm:ss
- Average post-call time Average of “Post-interaction time”, in mm:ss
- Average hold time Average of “Hold time”, in mm:ss
- Average processing time Average of “Total interaction time”, in mm:ss
- Number of calls, ATT, ACW, POH and APT / user
- Users Grouped by “User”
- Number of incoming calls Count of “Distribution date”
- ATT Average of “Communication time”, in mm:ss
- Average post-call time Average of “Post-interaction time”, in mm:ss
- Average hold time Average of “Hold time”, in mm:ss
- Average processing time Average of “Total interaction time”, in mm:ss
- Number of calls, QS and SLA / date
- Distribution date Grouped by “Distribution date”
- Number of incoming calls Count of “Distribution date”
- Number of processed calls Count of “Distribution date” · only if Interaction status = TREATED
- Number of aborted calls Count of “Distribution date” · only if Interaction status = CANCELED
- QS (%) “Number of processed calls” ÷ “Number of incoming calls” (in %)
- SLA (%) “Number of processed calls (sla)” ÷ “Number of processed calls” (in %)
- Number of calls, QS and SLA / queue
- Queues Grouped by “Queue”
- Number of incoming calls Count of “Distribution date”
- Number of processed calls Count of “Distribution date” · only if Interaction status = TREATED
- Number of aborted calls Count of “Distribution date” · only if Interaction status = CANCELED
- QS (%) “Number of processed calls” ÷ “Number of incoming calls” (in %)
- SLA (%) “Number of processed calls (sla)” ÷ “Number of processed calls” (in %)
- Number of distributions by date
- Distribution date Grouped by “Distribution date”
- Number of distributions Count of “Distribution date”
- Number of handled/abandoned distributions by date
- Distribution date Grouped by “Distribution date”
- Number of handled distributions Count of “Distribution date” · only if Interaction status = TREATED
- Number of abandoned distributions Count of “Distribution date” · only if Interaction status = CANCELED
- Number of incoming calls and ATT/distribution date
- Distribution date Grouped by “Distribution date”
- Number of incoming calls Count of “Distribution date”
- ATT Average of “Communication time”, in mm:ss
Pie chart
- Distribution by queue
- Queue Grouped by “Queue”
- Number of distributions Count of “Distribution date”
- Distribution by status
- Status Grouped by “Interaction status”
- Number of distributions Count of “Distribution date”
- Incoming call distribution by wait time in the queue
- Wait time (level) Grouped by “Wait time”
- Number of incoming calls Count of “Distribution date”
Single value square
- ATT
Average of “Communication time”, in mm:ss - Average hold time
Average of “Hold time”, in mm:ss - Average post-call time
Average of “Post-interaction time”, in mm:ss - Average processing time
Average of “Total interaction time”, in mm:ss - Average ringing time
Average of “User ringing time”, in mm:ss - Average waiting time
Average of “Wait time”, in mm:ss - Number of abandoned distributions
Count of “Distribution date” · only if Interaction status = CANCELED - Number of aborted calls
Count of “Distribution date” · only if Interaction status = CANCELED - Number of handled distributions
Count of “Distribution date” · only if Interaction status = TREATED - Number of incoming calls
Count of “Distribution date” - Number of incoming calls (wait time < 60 sec)
Count of “Distribution date” · only if Wait time < 60 - Number of missed calls
Count of “Distribution date” · only if Detailed interaction status = MISSED - Number of processed calls
Count of “Distribution date” · only if Interaction status = TREATED - Number of unique callers
Number of unique values of “Caller number” - Number of unique calls
Number of unique values of “Interaction ID” - QS (%)
“Number of processed calls” ÷ “Number of incoming calls” (in %) - SLA (%)
“Number of processed calls (sla)” ÷ “Number of processed calls” (in %)
Table
- Distributions table by queue
- Queue Grouped by “Queue”
- Number of distributions Count of “Distribution date”
- Number of handled distributions Count of “Distribution date” · only if Interaction status = TREATED
- Number of abandoned distributions Count of “Distribution date” · only if Interaction status = CANCELED
- Average waiting time Average of “Wait time”, in mm:ss
- Average handling time Average of “Communication time”, in mm:ss
- Distributions table by user
- User Grouped by “User”
- Number of distributions Count of “Distribution date”
- Number of handled distributions Count of “Distribution date” · only if Interaction status = TREATED
- Number of abandoned distributions Count of “Distribution date” · only if Interaction status = CANCELED
- Average handling time Average of “Communication time”, in mm:ss
Calculated data
Data · Average
- ATT
Average of “Communication time”, in mm:ss - Average handling time
Average of “Communication time”, in mm:ss - Average hold time
Average of “Hold time”, in mm:ss - Average post-call time
Average of “Post-interaction time”, in mm:ss - Average processing time
Average of “Total interaction time”, in mm:ss - Average ringing time
Average of “User ringing time”, in mm:ss - Average waiting time
Average of “Wait time”, in mm:ss
Data · Count
- Number of abandoned distributions
Count of “Distribution date” · only if Interaction status = CANCELED - Number of aborted calls
Count of “Distribution date” · only if Interaction status = CANCELED - Number of distributions
Count of “Distribution date” - Number of handled distributions
Count of “Distribution date” · only if Interaction status = TREATED - Number of incoming calls
Count of “Distribution date” - Number of missed calls
Count of “Distribution date” · only if Detailed interaction status = MISSED - Number of processed calls
Count of “Distribution date” · only if Interaction status = TREATED - Number of processed calls (sla)
Count of “Distribution date” - Number of wait time < 60 sec
Count of “Distribution date” · only if Wait time < 60
Data · Number of unique values
- Number of unique callers
Number of unique values of “Caller number” - Number of unique calls
Number of unique values of “Interaction ID”
Formula
- QS (%)
“Number of processed calls” ÷ “Number of incoming calls” (in %) - SLA (%)
“Number of processed calls (sla)” ÷ “Number of processed calls” (in %)
Data group
- Distribution date
Grouped by “Distribution date” - Queue
Grouped by “Queue” - Queues
Grouped by “Queue” - Status
Grouped by “Interaction status” - User
Grouped by “User” - Users
Grouped by “User” - Wait time (level)
Grouped by “Wait time”
Boxplot
- Wait time
Min / Q1 / median / Q3 / max bounds on “Wait time”
4.4. Outgoing call distributions
KPI templates
Multi line
- No. of outgoing, answered and aborted calls / date
- Distribution date Grouped by “Distribution date”
- Number of outgoing calls Count of “Distribution date”
- Number of successful calls Count of “Distribution date” · only if Interaction status = TREATED
- Number of unsuccessful calls Count of “Distribution date” · only if Interaction status = CANCELED
- Rate of calls processed > 60 sec “Number of calls processed > 60sec” ÷ “Number of successful calls” (in %)
- Rate of calls processed > 90 sec “Number of calls processed > 90sec” ÷ “Number of successful calls” (in %)
- No. of outgoing, answered and aborted calls / queue
- Queues Grouped by “Queue”
- Number of outgoing calls Count of “Distribution date”
- Number of successful calls Count of “Distribution date” · only if Interaction status = TREATED
- Number of unsuccessful calls Count of “Distribution date” · only if Interaction status = CANCELED
- Rate of calls processed > 60 sec “Number of calls processed > 60sec” ÷ “Number of successful calls” (in %)
- Rate of calls processed > 90 sec “Number of calls processed > 90sec” ÷ “Number of successful calls” (in %)
- No. of outgoing, answered and aborted calls / user
- Users Grouped by “User”
- Number of outgoing calls Count of “Distribution date”
- Number of successful calls Count of “Distribution date” · only if Interaction status = TREATED
- Number of unsuccessful calls Count of “Distribution date” · only if Interaction status = CANCELED
- Rate of calls processed > 60 sec “Number of calls processed > 60sec” ÷ “Number of successful calls” (in %)
- Rate of calls processed > 90 sec “Number of calls processed > 90sec” ÷ “Number of successful calls” (in %)
- No. of outgoing, ATT, POH and ACW calls / date
- Distribution date Grouped by “Distribution date”
- Number of outgoing calls Count of “Distribution date”
- ATT Average of “Communication time”, in mm:ss
- POH Average of “Hold time”, in mm:ss · only if Interaction status = TREATED
- Average post-call time Average of “Post-interaction time”, in mm:ss
- Average processing time Average of “Total interaction time”, in mm:ss
- No. of outgoing, ATT, POH and ACW calls / queue
- Queues Grouped by “Queue”
- Number of outgoing calls Count of “Distribution date”
- ATT Average of “Communication time”, in mm:ss
- POH Average of “Hold time”, in mm:ss · only if Interaction status = TREATED
- Average post-call time Average of “Post-interaction time”, in mm:ss
- Average processing time Average of “Total interaction time”, in mm:ss
- No. of outgoing, ATT, POH and ACW calls / user
- Users Grouped by “User”
- Number of outgoing calls Count of “Distribution date”
- ATT Average of “Communication time”, in mm:ss
- POH Average of “Hold time”, in mm:ss · only if Interaction status = TREATED
- Average post-call time Average of “Post-interaction time”, in mm:ss
- Average processing time Average of “Total interaction time”, in mm:ss
- Number of outgoing calls and ATT/distribution date
- Distribution date Grouped by “Distribution date”
- Number of outgoing calls Count of “Distribution date”
- ATT Average of “Communication time”, in mm:ss
- Number of outgoing calls/date
- Distribution date Grouped by “Distribution date”
- Number of outgoing calls Count of “Distribution date”
- Number of successful calls Count of “Distribution date” · only if Interaction status = TREATED
- Number of unsuccessful calls Count of “Distribution date” · only if Interaction status = CANCELED
- Rate of calls processed > 60 sec “Number of calls processed > 60sec” ÷ “Number of successful calls” (in %)
Single value square
- ATT
Average of “Communication time”, in mm:ss - Average post-call time
Average of “Post-interaction time”, in mm:ss - Average processing time
Average of “Total interaction time”, in mm:ss - Average ringing time
Average of “User ringing time”, in mm:ss - Call rate > 60 sec
“Number of calls processed > 60sec” ÷ “Number of successful calls” (in %) - Call rate > 90 sec
“Number of calls processed > 90sec” ÷ “Number of successful calls” (in %) - Number of calls processed > 30 sec
Count of “Distribution date” · only if Communication time > 30 - Number of outgoing calls
Count of “Distribution date” - Number of successful calls
Count of “Distribution date” · only if Interaction status = TREATED - Number of unsuccessful calls
Count of “Distribution date” · only if Interaction status = CANCELED - POH
Average of “Hold time”, in mm:ss · only if Interaction status = TREATED - Total communication time
Sum of “Communication time”, in HH:mm:ss
Table
- Number of successful calls/queue
- Queues Grouped by “Queue”
- Number of outgoing calls Count of “Distribution date”
- Number of successful calls Count of “Distribution date” · only if Interaction status = TREATED
- ATT Average of “Communication time”, in mm:ss
- Rate of calls processed > 90 sec “Number of calls processed > 90sec” ÷ “Number of successful calls” (in %)
- Outgoing call overview per user
- Users Grouped by “User”
- Number of outgoing calls Count of “Distribution date”
- Number of successful calls Count of “Distribution date” · only if Interaction status = TREATED
- Number of unsuccessful calls Count of “Distribution date” · only if Interaction status = CANCELED
- Number of calls processed > 20sec Count of “Distribution date” · only if Communication time > 20
- Rate of completed calls “Number of outgoing calls” ÷ “Number of successful calls” (in %)
- ATT Average of “Communication time”, in mm:ss
- POH Average of “Hold time”, in mm:ss · only if Interaction status = TREATED
- Average post-call time Average of “Post-interaction time”, in mm:ss
- Average processing time Average of “Total interaction time”, in mm:ss
Calculated data
Data · Average
- ATT
Average of “Communication time”, in mm:ss - Average post-call time
Average of “Post-interaction time”, in mm:ss - Average processing time
Average of “Total interaction time”, in mm:ss - Average ringing time
Average of “User ringing time”, in mm:ss - POH
Average of “Hold time”, in mm:ss · only if Interaction status = TREATED
Data · Count
- Number of calls processed > 20sec
Count of “Distribution date” · only if Communication time > 20 - Number of calls processed > 30sec
Count of “Distribution date” · only if Communication time > 30 - Number of calls processed > 60sec
Count of “Distribution date” · only if Interaction status = TREATED and Communication time > 60 - Number of calls processed > 90sec
Count of “Distribution date” · only if Interaction status = TREATED and Communication time > 90 - Number of outgoing calls
Count of “Distribution date” - Number of successful calls
Count of “Distribution date” · only if Interaction status = TREATED - Number of unsuccessful calls
Count of “Distribution date” · only if Interaction status = CANCELED
Data · Sum
- Sum of communication times
Sum of “Communication time”, in HH:mm:ss
Formula
- Rate of calls processed > 60 sec
“Number of calls processed > 60sec” ÷ “Number of successful calls” (in %) - Rate of calls processed > 90 sec
“Number of calls processed > 90sec” ÷ “Number of successful calls” (in %) - Rate of completed calls
“Number of outgoing calls” ÷ “Number of successful calls” (in %)
Data group
- Communication time (level)
Grouped by “Communication time” - Distribution date
Grouped by “Distribution date” - Queues
Grouped by “Queue” - Users
Grouped by “User”
5. Email flow
Find all the data from your emails
5.1. Incoming emails
KPI templates
Multi line
- Number of incoming emails/date
- Send date Grouped by “Send date”
- Number of incoming emails Count of “Interaction ID”
Single value square
- Number of incoming emails
Count of “Interaction ID”
Calculated data
Data · Count
- Number of incoming emails
Count of “Interaction ID”
Data group
- Send date
Grouped by “Send date”
5.2. Outgoing emails
KPI templates
Multi line
- Number of outgoing emails/date
- Send date Grouped by “Send date”
- Number of outgoing emails Count of “Interaction ID”
Single value square
- Number of outgoing emails
Count of “Interaction ID”
Calculated data
Data · Count
- Number of outgoing emails
Count of “Interaction ID”
Data group
- Send date
Grouped by “Send date”
5.3. Incoming email distributions
KPI templates
Multi line
- Number of incoming emails and average wait time/distribution date
- Distribution date Grouped by “Distribution date”
- Number of incoming emails Count of “Distribution date”
- Average wait time Average of “Wait time”, in HH:mm:ss
Single value square
- Average wait time
Average of “Wait time”, in HH:mm:ss - Number of incoming emails
Count of “Distribution date”
Calculated data
Data · Average
- Average wait time
Average of “Wait time”, in HH:mm:ss
Data · Count
- Number of incoming emails
Count of “Distribution date”
Data group
- Distribution date
Grouped by “Distribution date”
5.4. Outgoing email distributions
KPI templates
Multi line
- Number of emails sent/send date
- Send date Grouped by “Distribution date”
- Number of emails sent Count of “Distribution date”
Single value square
- Number emails sent
Count of “Distribution date”
Calculated data
Data · Count
- Number of emails sent
Count of “Distribution date”
Data group
- Send date
Grouped by “Distribution date”
6. Messaging flow
Find all the data from your messages
6.1. Messages
KPI templates
Multi line
- Number of chat sessions/date
- Start date Grouped by “Session start”
- Number of chat sessions Count of “Interaction ID”
Single value square
- Number of chat sessions
Count of “Interaction ID”
Calculated data
Data · Count
- Number of chat sessions
Count of “Interaction ID”
Data group
- Start date
Grouped by “Session start”
6.2. Incoming message distributions
KPI templates
Multi line
- Number of incoming sessions and exchange time / distribution date
- Distribution date Grouped by “Distribution date”
- Number of incoming sessions Count of “Distribution date”
- Average exchange time Average of “Exchange time”, in mm:ss
Pie chart
- Outgoing call distribution by communication time
Single value square
- Average exchange time
Average of “Exchange time”, in mm:ss - Number of incoming sessions
Count of “Distribution date”
Calculated data
Data · Average
- Average exchange time
Average of “Exchange time”, in mm:ss
Data · Count
- Number of incoming sessions
Count of “Distribution date”
Data group
- Distribution date
Grouped by “Distribution date”
6.3. Outgoing message distributions
KPI templates
Multi line
- Number of outgoing sessions and exchange time / distribution date
- Distribution date Grouped by “Distribution date”
- Number of outgoing sessions Count of “Distribution date”
- Average exchange time Average of “Exchange time”, in mm:ss
Single value square
- Average exchange time
Average of “Exchange time”, in mm:ss - Number of outgoing sessions
Count of “Distribution date”
Calculated data
Data · Average
- Average exchange time
Average of “Exchange time”, in mm:ss
Data · Count
- Number of outgoing sessions
Count of “Distribution date”
Data group
- Distribution date
Grouped by “Distribution date”
6.4. SMS
KPI templates
Multi line
- Number of SMS by date
- Send date Grouped by “Send date”
- Number of SMS Count of “Send date”
- Number of SMS sent/received by date
- Send date Grouped by “Send date”
- Number of SMS sent Count of “Send date” · only if SMS category = OUT
- Number of SMS received Count of “Send date” · only if SMS category = IN
Pie chart
- Distribution by status
- Status Grouped by “Status”
- Number of SMS Count of “Send date”
- Distribution by type
- Type Grouped by “SMS category”
- Number of SMS Count of “Send date”
Single value square
- Credits consumed
Sum of “Credits” - Number of SMS
Count of “Send date” - Number of SMS received
Count of “Send date” · only if SMS category = IN - Number of SMS sent
Count of “Send date” · only if SMS category = OUT
Table
- SMS table by type
- Type Grouped by “SMS category”
- Number of SMS Count of “Send date”
- Credits consumed Sum of “Credits”
Calculated data
Data · Count
- Number of SMS
Count of “Send date” - Number of SMS received
Count of “Send date” · only if SMS category = IN - Number of SMS sent
Count of “Send date” · only if SMS category = OUT
Data · Sum
- Credits consumed
Sum of “Credits”
Data group
- Send date
Grouped by “Send date” - Status
Grouped by “Status” - Type
Grouped by “SMS category”
7. Multi Flow
Select data from your various flows
7.1. Distributions
KPI templates
Multi line
- Number of calls, ATT and QS/date
- Distribution date Grouped by “Distribution date”
- Number of incoming calls Count of “Distribution date” · only if Flow = voice and Direction = IN
- ATT Average of “Exchange time”, in mm:ss · only if Flow = voice and Direction = IN
- QS (%) “Number of processed incoming calls” ÷ “Number of incoming calls” (in %)
- Number of distributions/date
- Distribution date Grouped by “Distribution date”
- Number of distributions Count of “Distribution date”
- Number of incoming and outgoing conversations / user
- Users Grouped by “User”
- Number of incoming conversations Count of “Distribution date” · only if Flow = messaging and Direction = IN
- Number of outgoing conversations Count of “Distribution date” · only if Flow = messaging and Direction = OUT
- Number of incoming and outgoing conversations/queue
- Queues Grouped by “Queue”
- Number of incoming conversations Count of “Distribution date” · only if Flow = messaging and Direction = IN
- Number of outgoing conversations Count of “Distribution date” · only if Flow = messaging and Direction = OUT
- Average conversation wait time Average of “Wait time”, in HH:mm:ss · only if Flow = messaging and Wait time > 0
- Average conversation exchange time Average of “Exchange time”, in HH:mm:ss · only if Flow = messaging and Interaction status = TREATED
- Number of incoming and outgoing interactions/date
- Distribution date Grouped by “Distribution date”
- Number of processed incoming calls Count of “Distribution date” · only if Interaction status = TREATED and Flow = voice and Direction = IN
- Number of processed outgoing calls Count of “Distribution date” · only if Interaction status = TREATED and Flow = voice and Direction = OUT
- Number of outgoing conversations Count of “Distribution date” · only if Flow = messaging and Direction = OUT
- Number of outgoing emails Count of “Distribution date” · only if Flow = email and Direction = OUT
- Number of distributions Count of “Distribution date”
Single value square
- ATT
Average of “Exchange time”, in mm:ss · only if Flow = voice and Direction = IN - Average ringing time
Average of “User ringing time”, in mm:ss · only if Flow = voice - Number of calls
Count of “Distribution date” · only if Flow = voice - Number of distributions
Count of “Distribution date” - Number of incoming conversations
Count of “Distribution date” · only if Flow = messaging and Direction = IN - Number of outgoing conversations
Count of “Distribution date” · only if Flow = messaging and Direction = OUT - Number of processed incoming calls
Count of “Distribution date” · only if Interaction status = TREATED and Flow = voice - QS (%)
“Number of processed incoming calls” ÷ “Number of incoming calls” (in %)
Table
- Interaction overview / user
- Users Grouped by “User”
- Number of processed incoming calls Count of “Distribution date” · only if Interaction status = TREATED and Flow = voice and Direction = IN
- Number of processed outgoing calls Count of “Distribution date” · only if Interaction status = TREATED and Flow = voice and Direction = OUT
- Number of outgoing conversations Count of “Distribution date” · only if Flow = messaging and Direction = OUT
- Number of outgoing emails Count of “Distribution date” · only if Flow = email and Direction = OUT
Calculated data
Data · Average
- ATT
Average of “Exchange time”, in mm:ss · only if Flow = voice and Direction = IN - Average conversation exchange time
Average of “Exchange time”, in HH:mm:ss · only if Flow = messaging and Interaction status = TREATED - Average conversation wait time
Average of “Wait time”, in HH:mm:ss · only if Flow = messaging and Wait time > 0 - Average ringing time
Average of “User ringing time”, in mm:ss · only if Flow = voice
Data · Count
- Number of distributions
Count of “Distribution date” - Number of incoming calls
Count of “Distribution date” · only if Flow = voice and Direction = IN - Number of incoming conversations
Count of “Distribution date” · only if Flow = messaging and Direction = IN - Number of outgoing conversations
Count of “Distribution date” · only if Flow = messaging and Direction = OUT - Number of outgoing emails
Count of “Distribution date” · only if Flow = email and Direction = OUT - Number of processed calls
Count of “Distribution date” · only if Interaction status = TREATED and Flow = voice - Number of processed incoming calls
Count of “Distribution date” · only if Interaction status = TREATED and Flow = voice and Direction = IN - Number of processed outgoing calls
Count of “Distribution date” · only if Interaction status = TREATED and Flow = voice and Direction = OUT - Total number of calls
Count of “Distribution date” · only if Flow = voice
Formula
- QS (%)
“Number of processed incoming calls” ÷ “Number of incoming calls” (in %)
Data group
- Distribution date
Grouped by “Distribution date” - Queues
Grouped by “Queue” - Users
Grouped by “User”
7.2. Interactions
KPI templates
Multi line
- Number of interactions and duration by date
- Interaction date Grouped by “Interaction date”
- Number of interactions Count of “Interaction date”
- Average handling time Average of “Exchange time”, in mm:ss
- Number of interactions by date
- Interaction date Grouped by “Interaction date”
- Number of interactions Count of “Interaction date”
Pie chart
- Distribution by direction
- Direction Grouped by “Direction”
- Number of interactions Count of “Interaction date”
- Distribution by flow
- Flow Grouped by “Flow”
- Number of interactions Count of “Interaction date”
- Distribution by interaction type
- Interaction type Grouped by “Interaction type”
- Number of interactions Count of “Interaction date”
Single value square
- Average handling time
Average of “Exchange time”, in mm:ss - Number of interactions
Count of “Interaction date” - Number of unique callers
Number of unique values of “Contact”
Table
- Interactions table by flow
- Flow Grouped by “Flow”
- Number of interactions Count of “Interaction date”
- Average handling time Average of “Exchange time”, in mm:ss
- Total handling time Sum of “Exchange time”, in mm:ss
Calculated data
Data · Average
- Average handling time
Average of “Exchange time”, in mm:ss
Data · Count
- Number of interactions
Count of “Interaction date”
Data · Number of unique values
- Number of unique callers
Number of unique values of “Contact”
Data · Sum
- Total handling time
Sum of “Exchange time”, in mm:ss
Data group
- Direction
Grouped by “Direction” - Flow
Grouped by “Flow” - Interaction date
Grouped by “Interaction date” - Interaction type
Grouped by “Interaction type” - Status
Grouped by “Status”
8. User
Find all the data generated by your users
8.1. Activities
KPI templates
Multi line
- Number of activities by date
- Start date Grouped by “Activity start date”
- Total handling time Sum of “Processing time”, in mm:ss
- Total non-handling time Sum of “Non-processing time”, in mm:ss
- Total connection time Sum of “Total time”, in mm:ss
- Number of activities/date
- Start date Grouped by “Activity start date”
- Number of activities Count of “Activity start date”
Pie chart
- Activity distribution by total time
- Activities Grouped by “tag”
- Sum of the total time Sum of “Total time”, in HH:mm:ss
- Distribution by activity code
- Activity code Grouped by “Activity”
- Total non-handling time Sum of “Non-processing time”, in mm:ss
- Distribution by activity type
- Activity type Grouped by “Type”
- Total connection time Sum of “Total time”, in mm:ss
Single value square
- Handling time
Sum of “Processing time”, in mm:ss - Non-handling time
Sum of “Non-processing time”, in mm:ss - Number of activities
Count of “Activity start date” - Total connection time
Sum of “Total time”, in mm:ss
Table
- Activities table by type
- Activity type Grouped by “Type”
- Total handling time Sum of “Processing time”, in mm:ss
- Total non-handling time Sum of “Non-processing time”, in mm:ss
- Total connection time Sum of “Total time”, in mm:ss
- Number of sessions Count of “Activity start date”
- Activities table by user
- User Grouped by “User”
- Total handling time Sum of “Processing time”, in mm:ss
- Total non-handling time Sum of “Non-processing time”, in mm:ss
- Total connection time Sum of “Total time”, in mm:ss
- Number of sessions Count of “Activity start date”
Calculated data
Data · Count
- Number of activities
Count of “Activity start date” - Number of sessions
Count of “Activity start date”
Data · Sum
- Sum of the total time
Sum of “Total time”, in HH:mm:ss - Total connection time
Sum of “Total time”, in mm:ss - Total handling time
Sum of “Processing time”, in mm:ss - Total non-handling time
Sum of “Non-processing time”, in mm:ss
Data group
- Activities
Grouped by “tag” - Activity code
Grouped by “Activity” - Activity type
Grouped by “Type” - Start date
Grouped by “Activity start date” - User
Grouped by “User”
8.2. Users’ interactions
KPI templates
Multi line
- Number of user interactions/date
- Start date Grouped by “Interaction start date”
- Number of user interactions Count of “Interaction start date”
Single value square
- Number of user interactions
Count of “Interaction start date”
Calculated data
Data · Count
- Number of user interactions
Count of “Interaction start date”
Data group
- Start date
Grouped by “Interaction start date”
8.3. User interaction presentations
KPI templates
Heat map
- Presentations / queue overview
- Presentation date Grouped by “Presentation date”
- Queues Grouped by “Queue”
- Accepted presentation rate “Number of presentations” ÷ “Number of presentations accepted” (in %)
- Presentations / user overview
- Presentation date Grouped by “Presentation date”
- Users Grouped by “User”
- Accepted presentation rate “Number of presentations” ÷ “Number of presentations accepted” (in %)
Multi line
- Number of presentations / date
- Presentation date Grouped by “Presentation date”
- Number of presentations accepted Count of “Presentation date” · only if Presentation status = ACCEPTED
- Number of presentations missed Count of “Presentation date” · only if Presentation status = MISSED
- Number of presentations refused Count of “Presentation date” · only if Presentation status = REFUSED
Pie chart
- Interaction distribution presented per result
- Statuses Grouped by “Presentation status”
- Number of presentations Count of “Presentation date”
Single value square
- Accepted presentation rate
“Number of presentations” ÷ “Number of presentations accepted” (in %) - Number of interactions presented
Count of “Presentation date”
Calculated data
Data · Count
- Number of presentations
Count of “Presentation date” - Number of presentations accepted
Count of “Presentation date” · only if Presentation status = ACCEPTED - Number of presentations missed
Count of “Presentation date” · only if Presentation status = MISSED - Number of presentations refused
Count of “Presentation date” · only if Presentation status = REFUSED
Formula
- Accepted presentation rate
“Number of presentations” ÷ “Number of presentations accepted” (in %)
Data group
- Presentation date
Grouped by “Presentation date” - Queues
Grouped by “Queue” - Statuses
Grouped by “Presentation status” - Users
Grouped by “User”
9. INO cx campaigns
Find all the data from your INO cx campaigns
9.1. Call campaign attempts
KPI templates
Multi line
- Number of attempted VOICE campaign calls/date
- Call date Grouped by “Start date”
- Number of attempted VOICE campaign calls Count of “Attempt ID”
- Number of attempts by date
- Attempt date Grouped by “Start date”
- Number of attempts Count of “Start date”
Pie chart
- Attempt distribution by result
- Result Grouped by “Result”
- Number of attempts Count of “Start date”
- Campaign call attempt distribution by status
- Status Grouped by “Result”
- Number of attempted VOICE campaign calls Count of “Attempt ID”
Single value square
- Average handling time
Average of “Communication time”, in mm:ss - Number of attempted VOICE campaign calls
Count of “Attempt ID” - Number of attempts
Count of “Start date”
Table
- Attempts table by voice campaign
- Voice campaign Grouped by “Call campaigns”
- Number of attempts Count of “Start date”
- Average handling time Average of “Communication time”, in mm:ss
Calculated data
Data · Average
- Average handling time
Average of “Communication time”, in mm:ss
Data · Count
- Number of attempted VOICE campaign calls
Count of “Attempt ID” - Number of attempts
Count of “Start date”
Data group
- Attempt date
Grouped by “Start date” - Call date
Grouped by “Start date” - Result
Grouped by “Result” - Status
Grouped by “Result” - Voice campaign
Grouped by “Call campaigns”
9.2. Call campaign targets
KPI templates
Multi line
- Number of targets by date
- Import date Grouped by “Import date”
- Number of targets Count of “Import date”
- Number of VOICE campaign targets/date
- Start date Grouped by “Start date”
- Number of VOICE campaign targets Count of “Target ID”
Pie chart
- Call campaign target distribution by status
- Status Grouped by “Result”
- Number of VOICE campaign targets Count of “Target ID”
- Target distribution by campaign
- Voice campaign Grouped by “Call campaigns”
- Number of targets Count of “Import date”
- Target distribution by result
- Result Grouped by “Result”
- Number of targets Count of “Import date”
Single value square
- Average number of attempts
Average of “Number of attempts” - Number of targets
Count of “Import date” - Number of VOICE campaign targets
Count of “Target ID”
Table
- Targets table by campaign
- Voice campaign Grouped by “Call campaigns”
- Number of targets Count of “Import date”
- Average number of attempts Average of “Number of attempts”
- Total number of attempts Sum of “Number of attempts”
Calculated data
Data · Average
- Average number of attempts
Average of “Number of attempts”
Data · Count
- Number of targets
Count of “Import date” - Number of VOICE campaign targets
Count of “Target ID”
Data · Sum
- Total number of attempts
Sum of “Number of attempts”
Data group
- Import date
Grouped by “Import date” - Result
Grouped by “Result” - Start date
Grouped by “Start date” - Status
Grouped by “Result” - Voice campaign
Grouped by “Call campaigns”
9.3. SMS campaign attempts
KPI templates
Multi line
- Number of SMS campaigns sent/date
- Send date Grouped by “Start date”
- Number of SMS campaigns sent Count of “Attempt ID”
Single value square
- Number of SMS campaigns sent
Count of “Attempt ID”
Calculated data
Data · Count
- Number of SMS campaigns sent
Count of “Attempt ID”
Data group
- Send date
Grouped by “Start date”
9.4. SMS campaign targets
KPI templates
Multi line
- Number of SMS campaign targets/date
- Start date Grouped by “Start date”
- Number of SMS campaign targets Count of “Target ID”
Single value square
- Number of SMS campaign targets
Count of “Target ID”
Calculated data
Data · Count
- Number of SMS campaign targets
Count of “Target ID”
Data group
- Start date
Grouped by “Start date”
10. Cases
Find the data from your cases
10.1. Cases
KPI templates are not available for this data source: creation starts from scratch.
Calculated data
Data · Average
- Average opening time
Average of “Opening time”, in mm:ss
Data · Count
- Number of cases closed
Count of “Creation date” · only if Case closed = true - Number of cases created
Count of “Creation date” - Number of open cases
Count of “Creation date” · only if Case closed = false
Data · Sum
- Number of closures
Sum of “Number of closings” - Number of openings
Sum of “Number of openings”
Data group
- Case type
Grouped by “Type” - Creation date
Grouped by “Creation date” - Creator
Grouped by “Created by” - Opening reason
Grouped by “Reason” - Origin
Grouped by “Origin” - Owner
Grouped by “Owner” - Status
Grouped by “Status”
11. CRMs
Find the data from your CRMs
11.1. CRM
KPI templates are not available for this data source: creation starts from scratch.
Calculated data
Data · Count
- Number of CRM cards created
Count of “Addition date”
Data group
- Creation date
Grouped by “Addition date”
12. Qualifications
Find the data from your qualification questionnaires
12.1. Qualification of interactions
KPI templates are not available for this data source: creation starts from scratch.
Calculated data
Data · Count
- Number of complete qualifications
Count of “Qualification date” · only if Filling = complete - Number of empty qualifications
Count of “Qualification date” · only if Filling = empty - Number of partial qualifications
Count of “Qualification date” · only if Filling = partial - Number of qualifications
Count of “Qualification ID” - Number of qualifications
Count of “Qualification date”
Data · Number of unique values
- Number of qualified interactions (unique)
Number of unique values of “Interaction ID”
Data group
- Qualification date
Grouped by “Qualification date” - Queue
Grouped by “Queue” - User
Grouped by “User”
13. Payments
Find the data from your payment modules
13.1. Invoices
KPI templates
Heat map
- Invoice distribution by status and creation date
- Creation date Grouped by “Creation date”
- Status Grouped by “Status”
- Sum of the amounts Sum of “Amount”, in euros
Multi line
- Number of invoices/date
- Creation date Grouped by “Creation date”
- Number of invoices Count of “Invoice ID”
Single value square
- Number of invoices
Count of “Invoice ID”
Calculated data
Data · Count
- Number of invoices
Count of “Invoice ID”
Data · Sum
- Sum of the amounts
Sum of “Amount”, in euros
Data group
- Creation date
Grouped by “Creation date” - Status
Grouped by “Status”
14. Routing
Find the data generated by your smart routings
14.1. Smart Routing path
KPI templates
Multi line
- Number of actions traversed/date
- Transition date Grouped by “Transition date”
- Number of actions traversed Count of “Interaction ID”
Single value square
- Number of actions traversed
Count of “Interaction ID”
Calculated data
Data · Count
- Number of actions traversed
Count of “Interaction ID”
Data group
- Transition date
Grouped by “Transition date”
15. Invoicing data sources
Find all the data used for invoicing here from your INO cx account
15.1. Transactions
KPI templates
Multi line
- Amounts by date
- Payment date Grouped by “Payment date”
- Total amount Sum of “Amount”, in euros · only if Status = PAID
- Number of transactions by date
- Payment date Grouped by “Payment date”
- Number of paid transactions Count of “Payment date” · only if Status = PAID
Pie chart
- Distribution by module type
- Module type Grouped by “Payment module type”
- Number of paid transactions Count of “Payment date” · only if Status = PAID
Single value square
- Average amount
Average of “Amount”, in euros · only if Status = PAID - Number of paid transactions
Count of “Payment date” · only if Status = PAID - Total amount
Sum of “Amount”, in euros · only if Status = PAID
Table
- Transactions table by module
- Module Grouped by “Payment module”
- Number of transactions Count of “Payment date”
- Number of paid transactions Count of “Payment date” · only if Status = PAID
- Total amount Sum of “Amount”, in euros · only if Status = PAID
- Average amount Average of “Amount”, in euros · only if Status = PAID
Calculated data
Data · Average
- Average amount
Average of “Amount”, in euros · only if Status = PAID
Data · Count
- Number of paid transactions
Count of “Payment date” · only if Status = PAID - Number of transactions
Count of “Payment date”
Data · Sum
- Total amount
Sum of “Amount”, in euros · only if Status = PAID
Data group
- Module
Grouped by “Payment module” - Module type
Grouped by “Payment module type” - Payment date
Grouped by “Payment date” - Status
Grouped by “Status”
16. Real-time
Find all real-time data here
16.1. Queues
KPI templates
Multi line
- Waiting vs accepted calls by queue
- Queue Grouped by “Queue ID”
- Number of calls on hold Sum of “Number of calls on hold”
- Number of calls accepted Sum of “Number of calls accepted”
Pie chart
- Accepted calls distribution by queue
- Queue Grouped by “Queue ID”
- Number of calls accepted Sum of “Number of calls accepted”
- Waiting calls distribution by queue
- Queue Grouped by “Queue ID”
- Number of calls on hold Sum of “Number of calls on hold”
- Waiting emails distribution by queue
- Queue Grouped by “Queue ID”
- Number of emails in queue Sum of “Number of emails in queue”
Single value square
- Messaging quality of service (multi-channel)
“Number of messages accepted” ÷ (“Number of messages accepted” + “Number of messages canceled”) (in %) - Voice quality of service (multi-channel)
“Number of calls accepted” ÷ (“Number of calls accepted” + “Number of calls canceled”) (in %) - Waiting calls (multi-channel)
Sum of “Number of calls on hold” - Waiting emails (multi-channel)
Sum of “Number of emails in queue” - Waiting messagings (multi-channel)
Sum of “Number of messages in queue”
Table
- Voice table by queue (multi-channel)
- Queue Grouped by “Queue ID”
- Number of calls on hold Sum of “Number of calls on hold”
- Number of calls accepted Sum of “Number of calls accepted”
- Number of calls canceled Sum of “Number of calls canceled”
- Number of inactive voice advisors (flow not enabled) Sum of “Number of inactive advisors (voice flow not enabled)”
Calculated data
Data · Sum
- Number of advisors in Non-productive Unavailability-type activity (email flow)
Sum of “Number of advisors in Non-productive Unavailability-type activity (email flow)” - Number of advisors in Non-productive Unavailability-type activity (messaging flow)
Sum of “Number of advisors in Non-productive Unavailability-type activity (messaging flow)” - Number of advisors in Non-productive Unavailability-type activity (voice flow)
Sum of “Number of advisors in Non-productive Unavailability-type activity (voice flow)” - Number of advisors in processing (email flow)
Sum of “Number of advisors in processing (email flow)” - Number of advisors in processing (messaging flow)
Sum of “Number of advisors in processing (messaging flow)” - Number of advisors in processing (voice flow)
Sum of “Number of advisors in processing (voice flow)” - Number of advisors in Processing-type activity (email flow)
Sum of “Number of advisors in Processing-type activity (email flow)” - Number of advisors in Processing-type activity (messaging flow)
Sum of “Number of advisors in Processing-type activity (messaging flow)” - Number of advisors in Processing-type activity (voice flow)
Sum of “Number of advisors in Processing-type activity (voice flow)” - Number of advisors in Productive Unavailability-type activity (email flow)
Sum of “Number of advisors in Productive Unavailability-type activity (email flow)” - Number of advisors in Productive Unavailability-type activity (messaging flow)
Sum of “Number of advisors in Productive Unavailability-type activity (messaging flow)” - Number of advisors in Productive Unavailability-type activity (voice flow)
Sum of “Number of advisors in Productive Unavailability-type activity (voice flow)” - Number of calls accepted
Sum of “Number of calls accepted” - Number of calls being processed
Sum of “interactions.voice.inTreatment” - Number of calls canceled
Sum of “Number of calls canceled” - Number of calls missed
Sum of “Number of calls missed” - Number of calls on hold
Sum of “Number of calls on hold” - Number of calls refused
Sum of “Number of calls refused” - Number of emails accepted
Sum of “Number of emails accepted” - Number of emails being processed
Sum of “interactions.email.inTreatment” - Number of emails canceled
Sum of “Number of emails canceled” - Number of emails in queue
Sum of “Number of emails in queue” - Number of emails missed
Sum of “Number of emails missed” - Number of emails refused
Sum of “Number of emails refused” - Number of inactive email advisors (flow not enabled)
Sum of “Number of inactive advisors (email flow not enabled)” - Number of inactive messaging advisors (flow not enabled)
Sum of “Number of inactive advisors (messaging flow not enabled)” - Number of inactive voice advisors (flow not enabled)
Sum of “Number of inactive advisors (voice flow not enabled)” - Number of messages accepted
Sum of “Number of messages accepted” - Number of messages being processed
Sum of “interactions.messaging.inTreatment” - Number of messages canceled
Sum of “Number of messages canceled” - Number of messages in queue
Sum of “Number of messages in queue” - Number of messages missed
Sum of “Number of messages missed” - Number of messages refused
Sum of “Number of messages refused” - Total number of competent advisors (email flow)
Sum of “Total number of competent advisors (email flow)” - Total number of competent advisors (messaging flow)
Sum of “Total number of competent advisors (messaging flow)” - Total number of competent advisors (voice flow)
Sum of “Total number of competent advisors (voice flow)”
Formula
- Quality of service (messaging flow)
“Number of messages accepted” ÷ (“Number of messages accepted” + “Number of messages canceled”) (in %) - Quality of service (voice flow)
“Number of calls accepted” ÷ (“Number of calls accepted” + “Number of calls canceled”) (in %)
Data group
- Queue
Grouped by “Queue ID”
16.2. Voice queues
KPI templates
Multi line
- Accepted, canceled and missed voice calls by queue
- Voice queue Grouped by “Voice queue ID”
- Number of calls accepted Sum of “Number of calls accepted”
- Number of calls canceled Sum of “Number of calls canceled”
- Number of calls missed Sum of “Number of calls missed”
- Waiting vs accepted voice calls by queue
- Voice queue Grouped by “Voice queue ID”
- Number of calls on hold Sum of “Number of calls on hold”
- Number of calls accepted Sum of “Number of calls accepted”
Pie chart
- Accepted voice calls distribution by queue
- Voice queue Grouped by “Voice queue ID”
- Number of calls accepted Sum of “Number of calls accepted”
- Available voice advisors distribution by queue
- Voice queue Grouped by “Voice queue ID”
- Number of inactive voice advisors (flow not enabled) Sum of “Number of inactive advisors”
- Waiting voice calls distribution by queue
- Voice queue Grouped by “Voice queue ID”
- Number of calls on hold Sum of “Number of calls on hold”
Single value square
- Available voice advisors
Sum of “Number of inactive advisors” - Voice QoS
“Number of calls accepted” ÷ (“Number of calls accepted” + “Number of calls canceled”) (in %) - Waiting voice calls
Sum of “Number of calls on hold”
Table
- Voice advisors table by queue
- Voice queue Grouped by “Voice queue ID”
- Total number of competent advisors (voice flow) Sum of “Total number of competent advisors”
- Number of inactive voice advisors (flow not enabled) Sum of “Number of inactive advisors”
- Number of advisors in processing (voice flow) Sum of “Number of advisors in processing”
- Number of advisors in Processing-type activity (voice flow) Sum of “Number of advisors in Processing-type activity”
- Voice calls table by queue
- Voice queue Grouped by “Voice queue ID”
- Number of calls on hold Sum of “Number of calls on hold”
- Number of calls accepted Sum of “Number of calls accepted”
- Number of calls canceled Sum of “Number of calls canceled”
- Number of calls missed Sum of “Number of calls missed”
- Number of inactive voice advisors (flow not enabled) Sum of “Number of inactive advisors”
Calculated data
Data · Sum
- Number of advisors in Non-productive Unavailability-type activity (voice flow)
Sum of “Number of advisors in Non-productive Unavailability-type activity” - Number of advisors in processing (voice flow)
Sum of “Number of advisors in processing” - Number of advisors in Processing-type activity (voice flow)
Sum of “Number of advisors in Processing-type activity” - Number of advisors in Productive Unavailability-type activity (voice flow)
Sum of “Number of advisors in Productive Unavailability-type activity” - Number of calls accepted
Sum of “Number of calls accepted” - Number of calls being processed
Sum of “interactions.voice.inTreatment” - Number of calls canceled
Sum of “Number of calls canceled” - Number of calls missed
Sum of “Number of calls missed” - Number of calls on hold
Sum of “Number of calls on hold” - Number of calls refused
Sum of “Number of calls refused” - Number of inactive voice advisors (flow not enabled)
Sum of “Number of inactive advisors” - Total number of competent advisors (voice flow)
Sum of “Total number of competent advisors”
Formula
- Quality of service (voice flow)
“Number of calls accepted” ÷ (“Number of calls accepted” + “Number of calls canceled”) (in %)
Data group
- Voice queue
Grouped by “Voice queue ID”
16.3. Messaging queues
KPI templates
Multi line
- Waiting vs accepted messagings by queue
- Messaging queue Grouped by “Messaging queue ID”
- Number of messages in queue Sum of “Number of messages in queue”
- Number of messages accepted Sum of “Number of messages accepted”
Pie chart
- Accepted messagings distribution by queue
- Messaging queue Grouped by “Messaging queue ID”
- Number of messages accepted Sum of “Number of messages accepted”
- Waiting messagings distribution by queue
- Messaging queue Grouped by “Messaging queue ID”
- Number of messages in queue Sum of “Number of messages in queue”
Single value square
- Available messaging advisors
Sum of “Number of inactive advisors” - Messaging QoS
“Number of messages accepted” ÷ (“Number of messages accepted” + “Number of messages canceled”) (in %) - Waiting messagings
Sum of “Number of messages in queue”
Table
- Messaging advisors table by queue
- Messaging queue Grouped by “Messaging queue ID”
- Total number of competent advisors (messaging flow) Sum of “Total number of competent advisors”
- Number of inactive messaging advisors (flow not enabled) Sum of “Number of inactive advisors”
- Number of advisors in processing (messaging flow) Sum of “Number of advisors in processing”
- Number of advisors in Processing-type activity (messaging flow) Sum of “Number of advisors in Processing-type activity”
- Messagings table by queue
- Messaging queue Grouped by “Messaging queue ID”
- Number of messages in queue Sum of “Number of messages in queue”
- Number of messages accepted Sum of “Number of messages accepted”
- Number of messages canceled Sum of “Number of messages canceled”
- Number of inactive messaging advisors (flow not enabled) Sum of “Number of inactive advisors”
Calculated data
Data · Sum
- Number of advisors in Non-productive Unavailability-type activity (messaging flow)
Sum of “Number of advisors in Non-productive Unavailability-type activity” - Number of advisors in processing (messaging flow)
Sum of “Number of advisors in processing” - Number of advisors in Processing-type activity (messaging flow)
Sum of “Number of advisors in Processing-type activity” - Number of advisors in Productive Unavailability-type activity (messaging flow)
Sum of “Number of advisors in Productive Unavailability-type activity” - Number of inactive messaging advisors (flow not enabled)
Sum of “Number of inactive advisors” - Number of messages accepted
Sum of “Number of messages accepted” - Number of messages being processed
Sum of “interactions.messaging.inTreatment” - Number of messages canceled
Sum of “Number of messages canceled” - Number of messages in queue
Sum of “Number of messages in queue” - Number of messages missed
Sum of “Number of messages missed” - Number of messages refused
Sum of “Number of messages refused” - Total number of competent advisors (messaging flow)
Sum of “Total number of competent advisors”
Formula
- Quality of service (messaging flow)
“Number of messages accepted” ÷ (“Number of messages accepted” + “Number of messages canceled”) (in %)
Data group
- Messaging queue
Grouped by “Messaging queue ID”
16.4. Email queues
KPI templates
Multi line
- Waiting vs accepted emails by queue
- Email queue Grouped by “Email queue ID”
- Number of emails in queue Sum of “Number of emails in queue”
- Number of emails accepted Sum of “Number of emails accepted”
Pie chart
- Accepted emails distribution by queue
- Email queue Grouped by “Email queue ID”
- Number of emails accepted Sum of “Number of emails accepted”
- Waiting emails distribution by queue
- Email queue Grouped by “Email queue ID”
- Number of emails in queue Sum of “Number of emails in queue”
Single value square
- Available email advisors
Sum of “Number of inactive advisors” - Waiting emails
Sum of “Number of emails in queue”
Table
- Email advisors table by queue
- Email queue Grouped by “Email queue ID”
- Number of inactive email advisors (flow not enabled) Sum of “Number of inactive advisors”
- Number of advisors in processing (email flow) Sum of “Number of advisors in processing”
- Number of advisors in Processing-type activity (email flow) Sum of “Number of advisors in Processing-type activity”
- Emails table by queue
- Email queue Grouped by “Email queue ID”
- Number of emails in queue Sum of “Number of emails in queue”
- Number of emails accepted Sum of “Number of emails accepted”
- Number of emails canceled Sum of “Number of emails canceled”
- Number of inactive email advisors (flow not enabled) Sum of “Number of inactive advisors”
Calculated data
Data · Sum
- Number of advisors in Non-productive Unavailability-type activity (email flow)
Sum of “Number of advisors in Non-productive Unavailability-type activity” - Number of advisors in processing (email flow)
Sum of “Number of advisors in processing” - Number of advisors in Processing-type activity (email flow)
Sum of “Number of advisors in Processing-type activity” - Number of advisors in Productive Unavailability-type activity (email flow)
Sum of “Number of advisors in Productive Unavailability-type activity” - Number of emails accepted
Sum of “Number of emails accepted” - Number of emails being processed
Sum of “interactions.email.inTreatment” - Number of emails canceled
Sum of “Number of emails canceled” - Number of emails in queue
Sum of “Number of emails in queue” - Number of emails missed
Sum of “Number of emails missed” - Number of emails refused
Sum of “Number of emails refused” - Number of inactive email advisors (flow not enabled)
Sum of “Number of inactive advisors” - Total number of emails
Sum of “Total number of competent advisors”
Data group
- Email queue
Grouped by “Email queue ID”
16.5. Advisors
KPI templates
Multi line
- Inbound vs outbound calls by user
- User Grouped by “Advisor ID”
- Total number of incoming calls Sum of “Number of incoming calls received”
- Total number of outgoing calls Sum of “Number of outgoing calls made”
- Productive vs non-productive time by user
- User Grouped by “Advisor ID”
- Cumulative Productive Unavailability-type activity time Sum of “Cumulative Productive Unavailability-type activity time”, in HH:mm:ss
- Cumulative Non-productive Unavailability-type activity time Sum of “Cumulative Non-productive Unavailability-type activity time”, in HH:mm:ss
Pie chart
- Handling time distribution by user
- User Grouped by “Advisor ID”
- Cumulative Processing-type activity time Sum of “Cumulative Processing-type activity time”, in HH:mm:ss
- Inbound calls distribution by user
- User Grouped by “Advisor ID”
- Total number of incoming calls Sum of “Number of incoming calls received”
Single value square
- User handling time
Sum of “Cumulative Processing-type activity time”, in HH:mm:ss - User inbound calls
Sum of “Number of incoming calls received”
Table
- Activity table by user
- User Grouped by “Advisor ID”
- Cumulative Processing-type activity time Sum of “Cumulative Processing-type activity time”, in HH:mm:ss
- Cumulative Productive Unavailability-type activity time Sum of “Cumulative Productive Unavailability-type activity time”, in HH:mm:ss
- Cumulative Non-productive Unavailability-type activity time Sum of “Cumulative Non-productive Unavailability-type activity time”, in HH:mm:ss
- Interactions table by user
- User Grouped by “Advisor ID”
- Total number of incoming calls Sum of “Number of incoming calls received”
- Total number of outgoing calls Sum of “Number of outgoing calls made”
- Total number of incoming emails Sum of “Number of incoming emails received”
- Total number of incoming messages Sum of “Total number of incoming messages received”
Calculated data
Data · Average
- Average incoming call handle time
Average of “Average incoming call handle time”, in HH:mm:ss - Average incoming call post-interaction time
Average of “Average incoming call post-interaction time”, in HH:mm:ss - Average incoming call talk time
Average of “Average incoming call talk time”, in HH:mm:ss - Average incoming email handle time
Average of “Average incoming email handle time”, in HH:mm:ss - Average incoming email post-interaction time
Average of “Average incoming email post-interaction time”, in HH:mm:ss - Average incoming email talk time
Average of “Average incoming email editing time”, in HH:mm:ss - Average incoming message handle time
Average of “Average incoming message handle time”, in HH:mm:ss - Average incoming message post-interaction time
Average of “Average incoming message post-interaction time”, in HH:mm:ss - Average incoming message talk time
Average of “Average incoming message exchange time”, in HH:mm:ss - Average outgoing call handle time
Average of “Average outgoing call handle time”, in HH:mm:ss - Average outgoing call post-interaction time
Average of “Average outgoing call post-interaction time”, in HH:mm:ss - Average outgoing call talk time
Average of “Average outgoing call talk time”, in HH:mm:ss - Average outgoing email handle time
Average of “Average outgoing email handle time”, in HH:mm:ss - Average outgoing email post-interaction time
Average of “Average outgoing email post-interaction time”, in HH:mm:ss - Average outgoing email talk time
Average of “Average outgoing email editing time”, in HH:mm:ss - Average outgoing message handle time
Average of “Average outgoing message handle time”, in HH:mm:ss - Average outgoing message post-interaction time
Average of “Average outgoing message post-interaction time”, in HH:mm:ss - Average outgoing message talk time
Average of “Average outgoing message exchange time”, in HH:mm:ss
Data · Sum
- Cumulative Non-productive Unavailability-type activity time
Sum of “Cumulative Non-productive Unavailability-type activity time”, in HH:mm:ss - Cumulative Processing-type activity time
Sum of “Cumulative Processing-type activity time”, in HH:mm:ss - Cumulative Productive Unavailability-type activity time
Sum of “Cumulative Productive Unavailability-type activity time”, in HH:mm:ss - Total number of incoming calls
Sum of “Number of incoming calls received” - Total number of incoming emails
Sum of “Number of incoming emails received” - Total number of incoming messages
Sum of “Total number of incoming messages received” - Total number of outgoing calls
Sum of “Number of outgoing calls made” - Total number of outgoing emails
Sum of “Number of outgoing emails sent” - Total number of outgoing messages
Sum of “Number of outgoing messages sent”
Data group
- User
Grouped by “Advisor ID”
16.6. Voice advisors
KPI templates
Multi line
- AHT, ATT and ACW by user
- User Grouped by “User ID”
- Average incoming call handle time Average of “Average incoming call handle time”, in HH:mm:ss
- Average incoming call talk time Average of “Average incoming call talk time”, in HH:mm:ss
- Average incoming call post-interaction time Average of “Average incoming call post-interaction time”, in HH:mm:ss
- Inbound vs outbound voice calls by user
- User Grouped by “User ID”
- Total number of incoming calls Sum of “Number of incoming calls received”
- Total number of outgoing calls Sum of “Total number of outgoing calls made”
Pie chart
- Handling distribution by user
- User Grouped by “User ID”
- Cumulative Processing-type activity time Sum of “Cumulative Processing-type activity time”, in HH:mm:ss
- Inbound calls distribution by user
- User Grouped by “User ID”
- Total number of incoming calls Sum of “Number of incoming calls received”
Single value square
- Inbound calls AHT (Average Handling Time)
Average of “Average incoming call handle time”, in HH:mm:ss - Inbound voice calls
Sum of “Number of incoming calls received”
Table
- Voice activity table by user
- User Grouped by “User ID”
- Cumulative Processing-type activity time Sum of “Cumulative Processing-type activity time”, in HH:mm:ss
- Cumulative Productive Unavailability-type activity time Sum of “Cumulative Productive Unavailability-type activity time”, in HH:mm:ss
- Cumulative Non-productive Unavailability-type activity time Sum of “Cumulative Non-productive Unavailability-type activity time”, in HH:mm:ss
- Voice calls table by user
- User Grouped by “User ID”
- Total number of incoming calls Sum of “Number of incoming calls received”
- Total number of outgoing calls Sum of “Total number of outgoing calls made”
- Average incoming call handle time Average of “Average incoming call handle time”, in HH:mm:ss
- Average incoming call talk time Average of “Average incoming call talk time”, in HH:mm:ss
Calculated data
Data · Average
- Average incoming call handle time
Average of “Average incoming call handle time”, in HH:mm:ss - Average incoming call post-interaction time
Average of “Average incoming call post-interaction time”, in HH:mm:ss - Average incoming call talk time
Average of “Average incoming call talk time”, in HH:mm:ss - Average outgoing call handle time
Average of “Average outgoing call handle time”, in HH:mm:ss - Average outgoing call post-interaction time
Average of “Average outgoing call post-interaction time”, in HH:mm:ss - Average outgoing call talk time
Average of “Average outgoing call talk time”, in HH:mm:ss
Data · Sum
- Cumulative Non-productive Unavailability-type activity time
Sum of “Cumulative Non-productive Unavailability-type activity time”, in HH:mm:ss - Cumulative Processing-type activity time
Sum of “Cumulative Processing-type activity time”, in HH:mm:ss - Cumulative Productive Unavailability-type activity time
Sum of “Cumulative Productive Unavailability-type activity time”, in HH:mm:ss - Total number of incoming calls
Sum of “Number of incoming calls received” - Total number of outgoing calls
Sum of “Total number of outgoing calls made”
Data group
- User
Grouped by “User ID”
16.7. Email advisors
KPI templates
Multi line
- Inbound vs outbound emails by user
- User Grouped by “User ID”
- Total number of incoming emails Sum of “Total number of incoming emails”
- Total number of outgoing emails Sum of “Total number of outgoing emails”
- Productive vs non-productive time by user (email)
- User Grouped by “User ID”
- Cumulative Productive Unavailability-type activity time Sum of “Cumulative Productive Unavailability-type activity time”, in HH:mm:ss
- Cumulative Non-productive Unavailability-type activity time Sum of “Cumulative Non-productive Unavailability-type activity time”, in HH:mm:ss
Pie chart
- Inbound emails distribution by user
- User Grouped by “User ID”
- Total number of incoming emails Sum of “Total number of incoming emails”
Single value square
- Inbound emails
Sum of “Total number of incoming emails”
Table
- Email activity table by user
- User Grouped by “User ID”
- Cumulative Processing-type activity time Sum of “Cumulative Processing-type activity time”, in HH:mm:ss
- Cumulative Productive Unavailability-type activity time Sum of “Cumulative Productive Unavailability-type activity time”, in HH:mm:ss
- Cumulative Non-productive Unavailability-type activity time Sum of “Cumulative Non-productive Unavailability-type activity time”, in HH:mm:ss
- Emails table by user
- User Grouped by “User ID”
- Total number of incoming emails Sum of “Total number of incoming emails”
- Total number of outgoing emails Sum of “Total number of outgoing emails”
- Average incoming email handle time Average of “Average incoming email handle time”, in HH:mm:ss
- Average incoming email talk time Average of “Average incoming email editing time”, in HH:mm:ss
Calculated data
Data · Average
- Average incoming email handle time
Average of “Average incoming email handle time”, in HH:mm:ss - Average incoming email post-interaction time
Average of “Average incoming email post-interaction time”, in HH:mm:ss - Average incoming email talk time
Average of “Average incoming email editing time”, in HH:mm:ss - Average outgoing email handle time
Average of “Average outgoing email handle time”, in HH:mm:ss - Average outgoing email post-interaction time
Average of “Average outgoing email post-interaction time”, in HH:mm:ss - Average outgoing email talk time
Average of “Average outgoing email editing time”, in HH:mm:ss
Data · Sum
- Cumulative Non-productive Unavailability-type activity time
Sum of “Cumulative Non-productive Unavailability-type activity time”, in HH:mm:ss - Cumulative Processing-type activity time
Sum of “Cumulative Processing-type activity time”, in HH:mm:ss - Cumulative Productive Unavailability-type activity time
Sum of “Cumulative Productive Unavailability-type activity time”, in HH:mm:ss - Total number of incoming emails
Sum of “Total number of incoming emails” - Total number of outgoing emails
Sum of “Total number of outgoing emails”
Data group
- User
Grouped by “User ID”
16.8. Messaging advisors
KPI templates
Multi line
- Inbound vs outbound messagings by user
- User Grouped by “User ID”
- Total number of incoming messages Sum of “Total number of incoming messages”
- Total number of outgoing messages Sum of “Total number of outgoing messages”
- Productive vs non-productive time by user (messaging)
- User Grouped by “User ID”
- Cumulative Productive Unavailability-type activity time Sum of “Cumulative Productive Unavailability-type activity time”, in HH:mm:ss
- Cumulative Non-productive Unavailability-type activity time Sum of “Cumulative Non-productive Unavailability-type activity time”, in HH:mm:ss
Pie chart
- Inbound messagings distribution by user
- User Grouped by “User ID”
- Total number of incoming messages Sum of “Total number of incoming messages”
Single value square
- Inbound messagings
Sum of “Total number of incoming messages”
Table
- Messaging activity table by user
- User Grouped by “User ID”
- Cumulative Processing-type activity time Sum of “Cumulative Processing-type activity time”, in HH:mm:ss
- Cumulative Productive Unavailability-type activity time Sum of “Cumulative Productive Unavailability-type activity time”, in HH:mm:ss
- Cumulative Non-productive Unavailability-type activity time Sum of “Cumulative Non-productive Unavailability-type activity time”, in HH:mm:ss
- Messagings table by user
- User Grouped by “User ID”
- Total number of incoming messages Sum of “Total number of incoming messages”
- Total number of outgoing messages Sum of “Total number of outgoing messages”
- Average incoming message handle time Average of “Average incoming message handle time”, in HH:mm:ss
- Average incoming message talk time Average of “Average incoming message exchange time”, in HH:mm:ss
Calculated data
Data · Average
- Average incoming message handle time
Average of “Average incoming message handle time”, in HH:mm:ss - Average incoming message post-interaction time
Average of “Average incoming message post-interaction time”, in HH:mm:ss - Average incoming message talk time
Average of “Average incoming message exchange time”, in HH:mm:ss - Average outgoing message handle time
Average of “Average outgoing message handle time”, in HH:mm:ss - Average outgoing message post-interaction time
Average of “Average outgoing message post-interaction time”, in HH:mm:ss - Average outgoing message talk time
Average of “Average outgoing message exchange time”, in HH:mm:ss
Data · Sum
- Cumulative Non-productive Unavailability-type activity time
Sum of “Cumulative Non-productive Unavailability-type activity time”, in HH:mm:ss - Cumulative Processing-type activity time
Sum of “Cumulative Processing-type activity time”, in HH:mm:ss - Cumulative Productive Unavailability-type activity time
Sum of “Cumulative Productive Unavailability-type activity time”, in HH:mm:ss - Total number of incoming messages
Sum of “Total number of incoming messages” - Total number of outgoing messages
Sum of “Total number of outgoing messages”
Data group
- User
Grouped by “User ID”
16.9. Voice campaigns
KPI templates
Multi line
- Total vs remaining targets by campaign
- Voice campaign Grouped by “Voice campaign ID”
- Total number of targets Sum of “Total number of targets”
- Number of targets in queue Sum of “Total number of targets”
Pie chart
- Remaining targets distribution by campaign
- Voice campaign Grouped by “Voice campaign ID”
- Number of targets in queue Sum of “Total number of targets”
- Total targets distribution by campaign
- Voice campaign Grouped by “Voice campaign ID”
- Total number of targets Sum of “Total number of targets”
Single value square
- Remaining campaign targets
Sum of “Total number of targets” - Total campaign targets
Sum of “Total number of targets”
Table
- Targets table by campaign
- Voice campaign Grouped by “Voice campaign ID”
- Total number of targets Sum of “Total number of targets”
- Number of targets in queue Sum of “Total number of targets”
Calculated data
Data · Sum
- Number of targets in queue
Sum of “Total number of targets” - Total number of targets
Sum of “Total number of targets”
Data group
- Voice campaign
Grouped by “Voice campaign ID”
17. Data sources with no KPI list
On the following data sources, the Create a new KPI screen offers no List of available KPIs: creation always starts from scratch.
- Database
- Surveys
- External data sources
- Scripts
- Recordings
- Evaluation
Note: the absence of a list never limits what you can create. Every visualisation type and every calculated data type remains available on every data source.