[Reading time: 2 minutes]
Overview
Calculated data is a custom metric created from existing fields and measures in an exploration. It can be used to perform arithmetic, logical or conditional operations directly in the Reporter.

In an exploration, the calculated data is used to create a KPI that is not available with the proposed templates.
If you need information, please first consult the article on explorations or KPIs.
To access calculated data, you need to open an exploration, KPIs tab, then click ‘Create a KPI’.
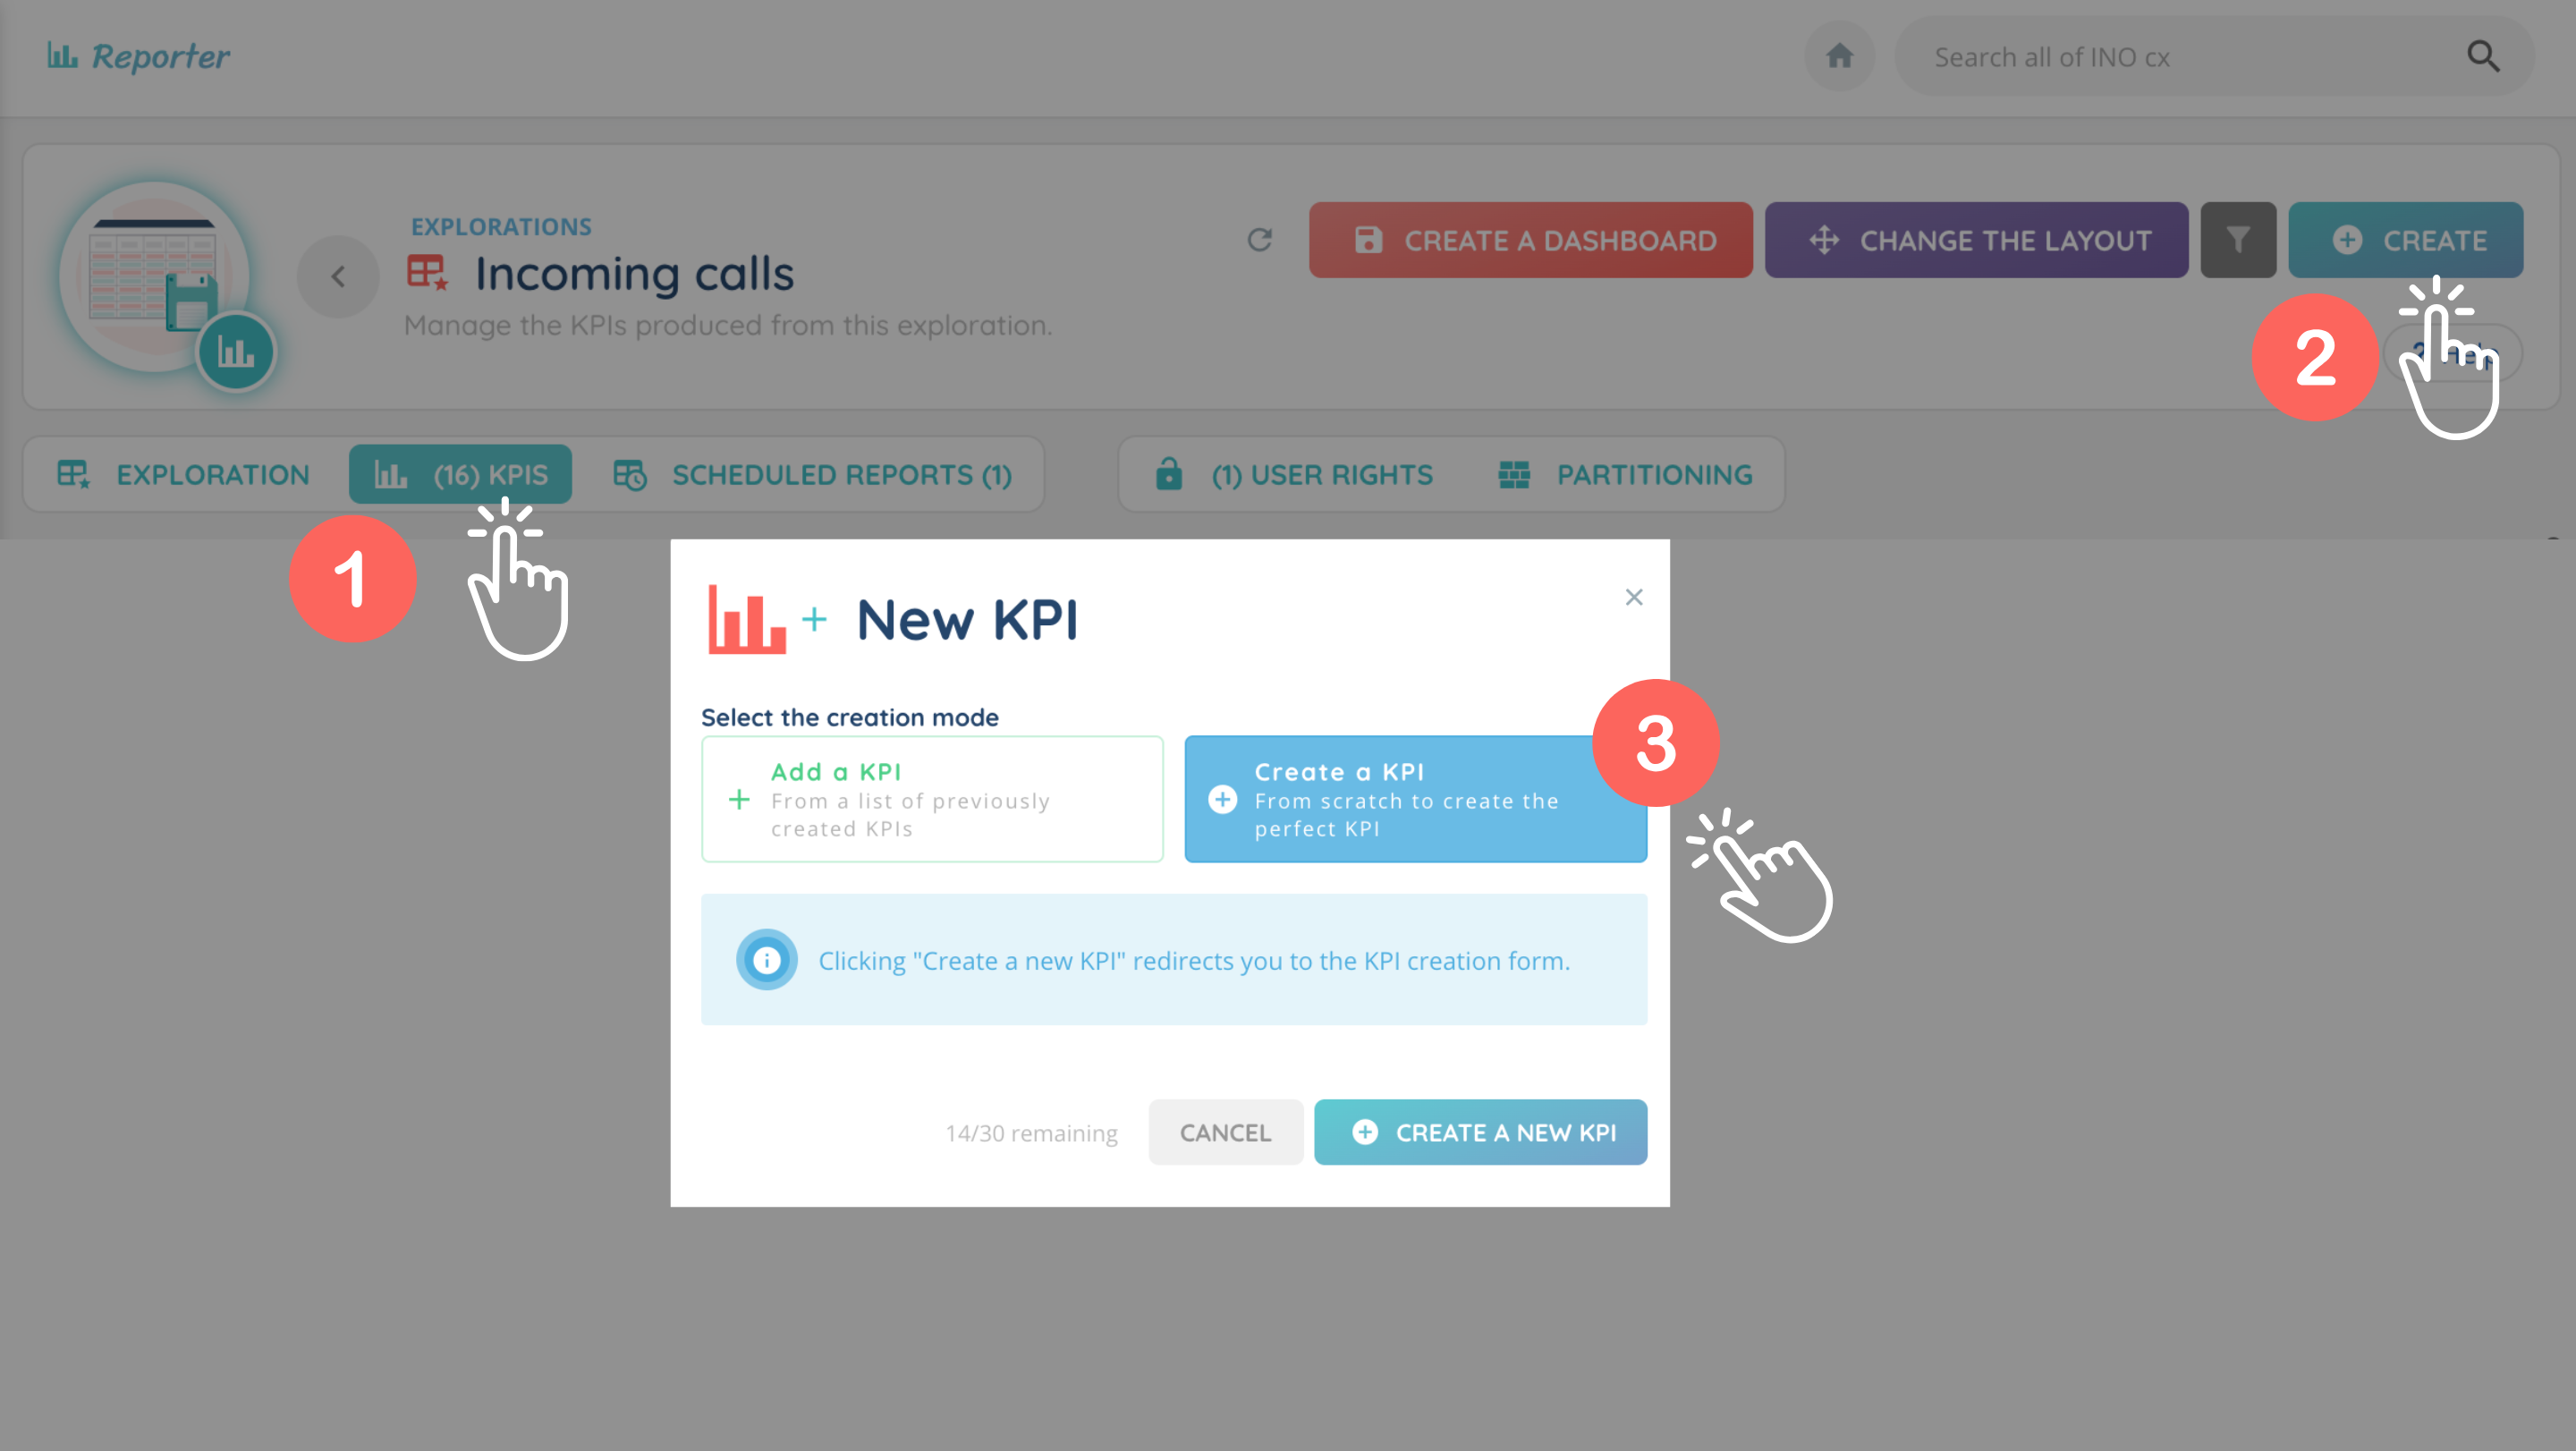
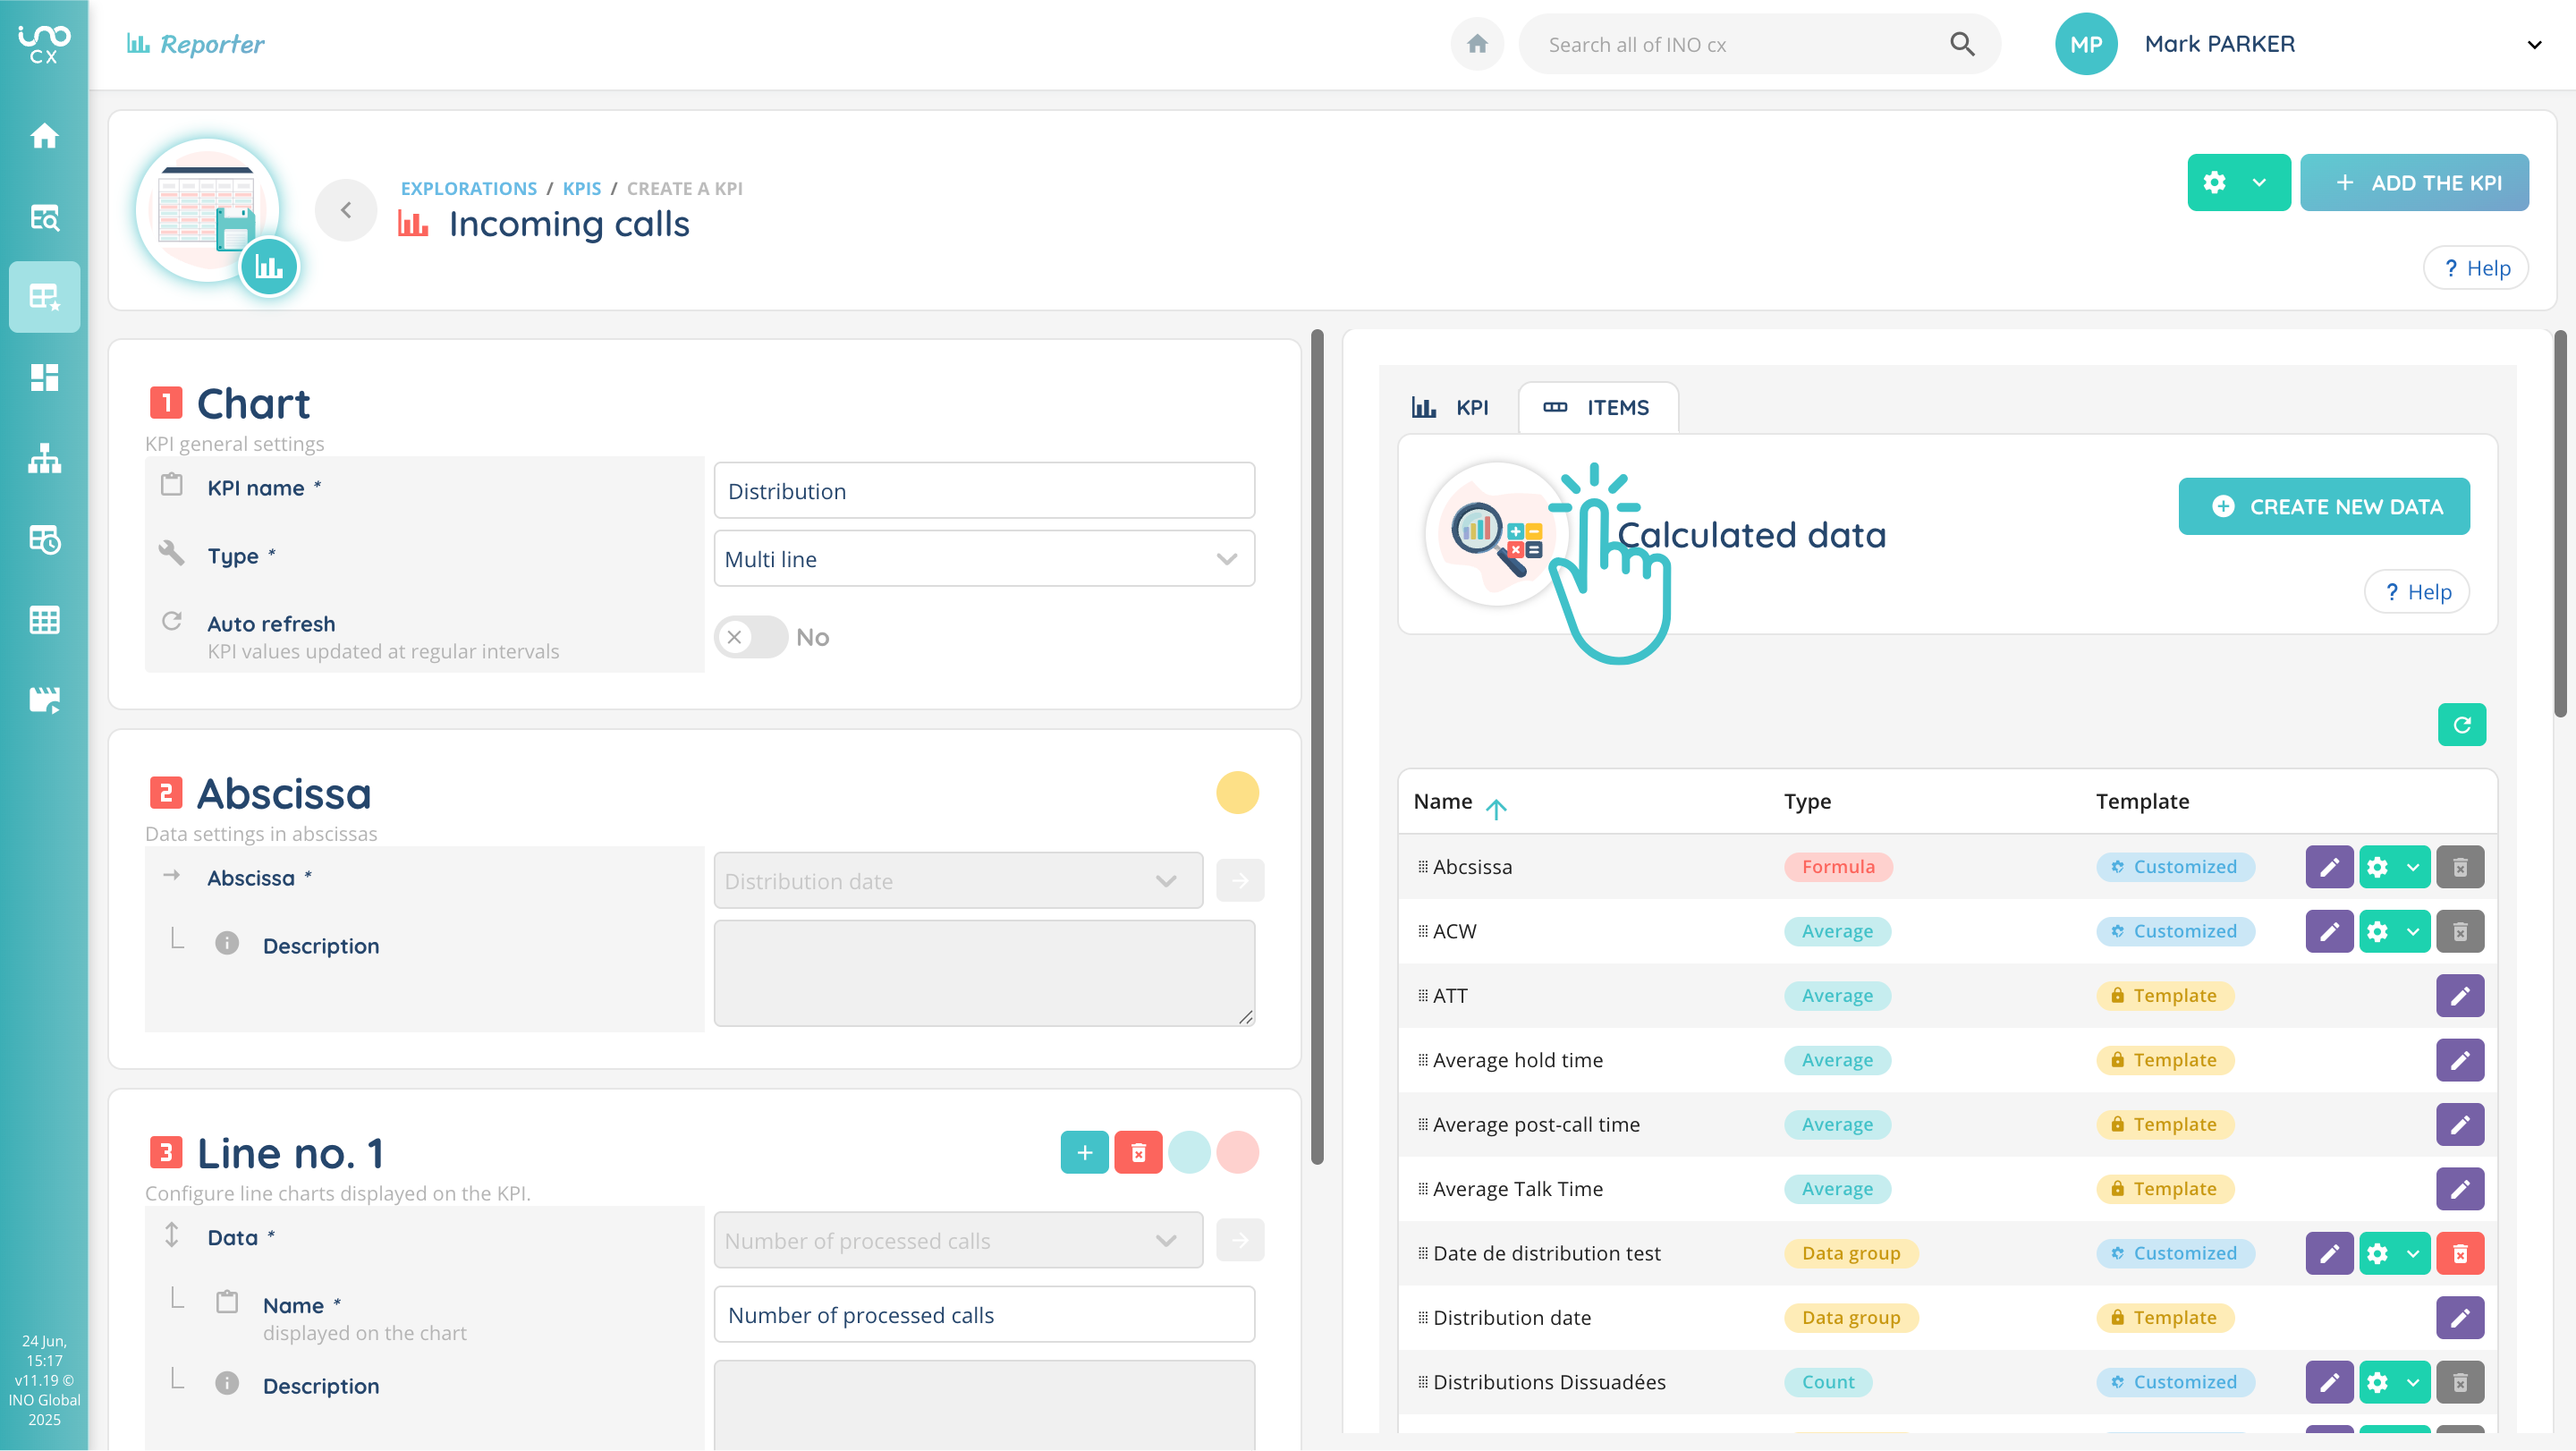
Calculated data are displayed on the right-hand side of the screen (“Items” tab).
Data types
All the calculated data available for the explorations to which you have access are in the “Items” tab. They are divided into two main categories:
- Template (yellow): default data
- Customized (blue): created data
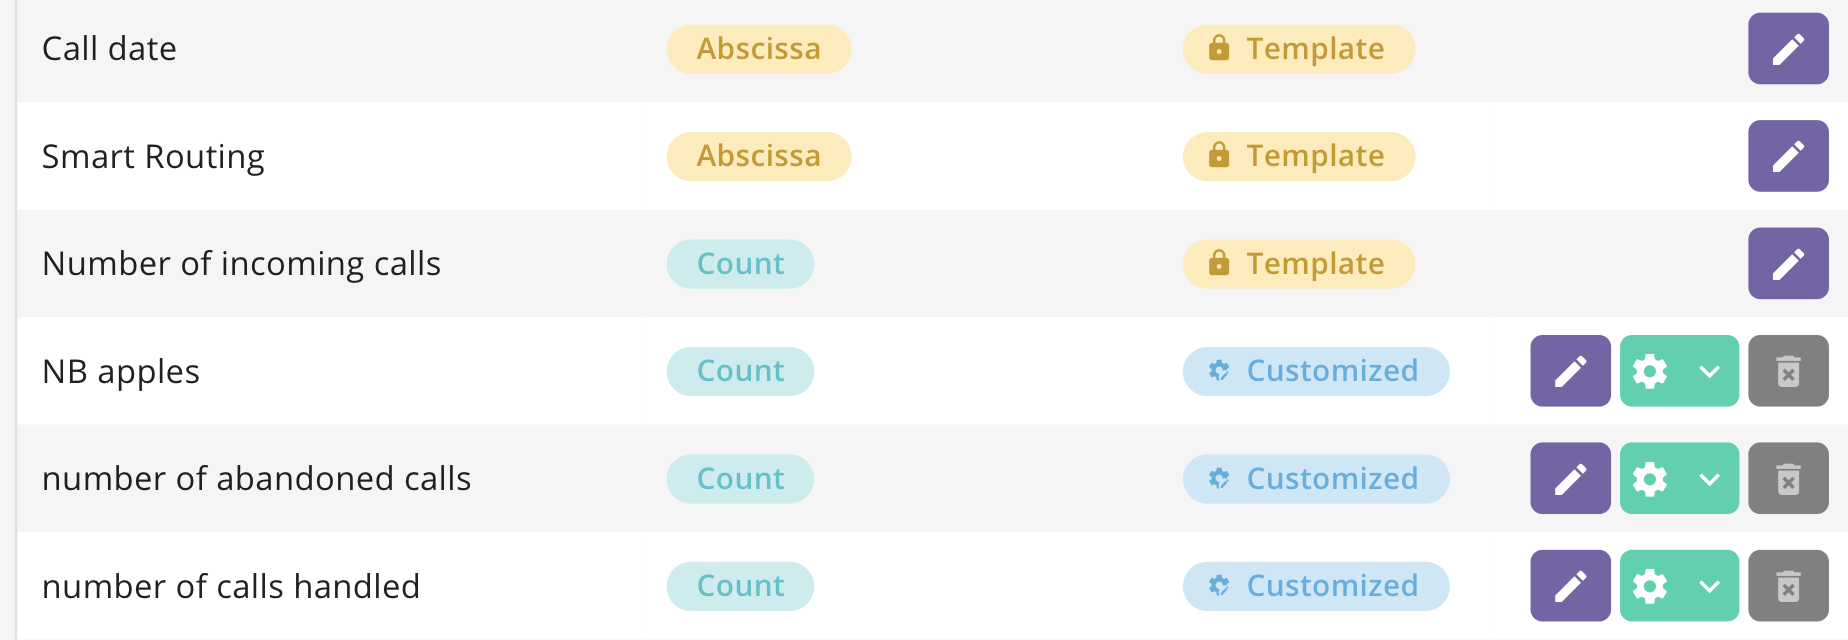
Template data cannot be modified or deleted.
Customized data cannot be deleted if at least one KPI or calculation uses it.
Calculated data creation
In the previous ‘items’ tab, click ‘Create new data’.
You can choose between 4 types of data when you create your data:

Data groups
Data groups are used in many KPIs: multi-line, pie chart, tables, etc. These are the data shown in yellow in the items table.
The calculation is based on one column of the exploration.

Depending on the column selected, the parameters linked to the data will be different.
Boxplot
Boxplot data are exclusive to Boxplot KPI. These are the data shown in purple in the items table.
To configure them, simply select a number-type column (e.g. Total interaction time) and then choose the return value format.

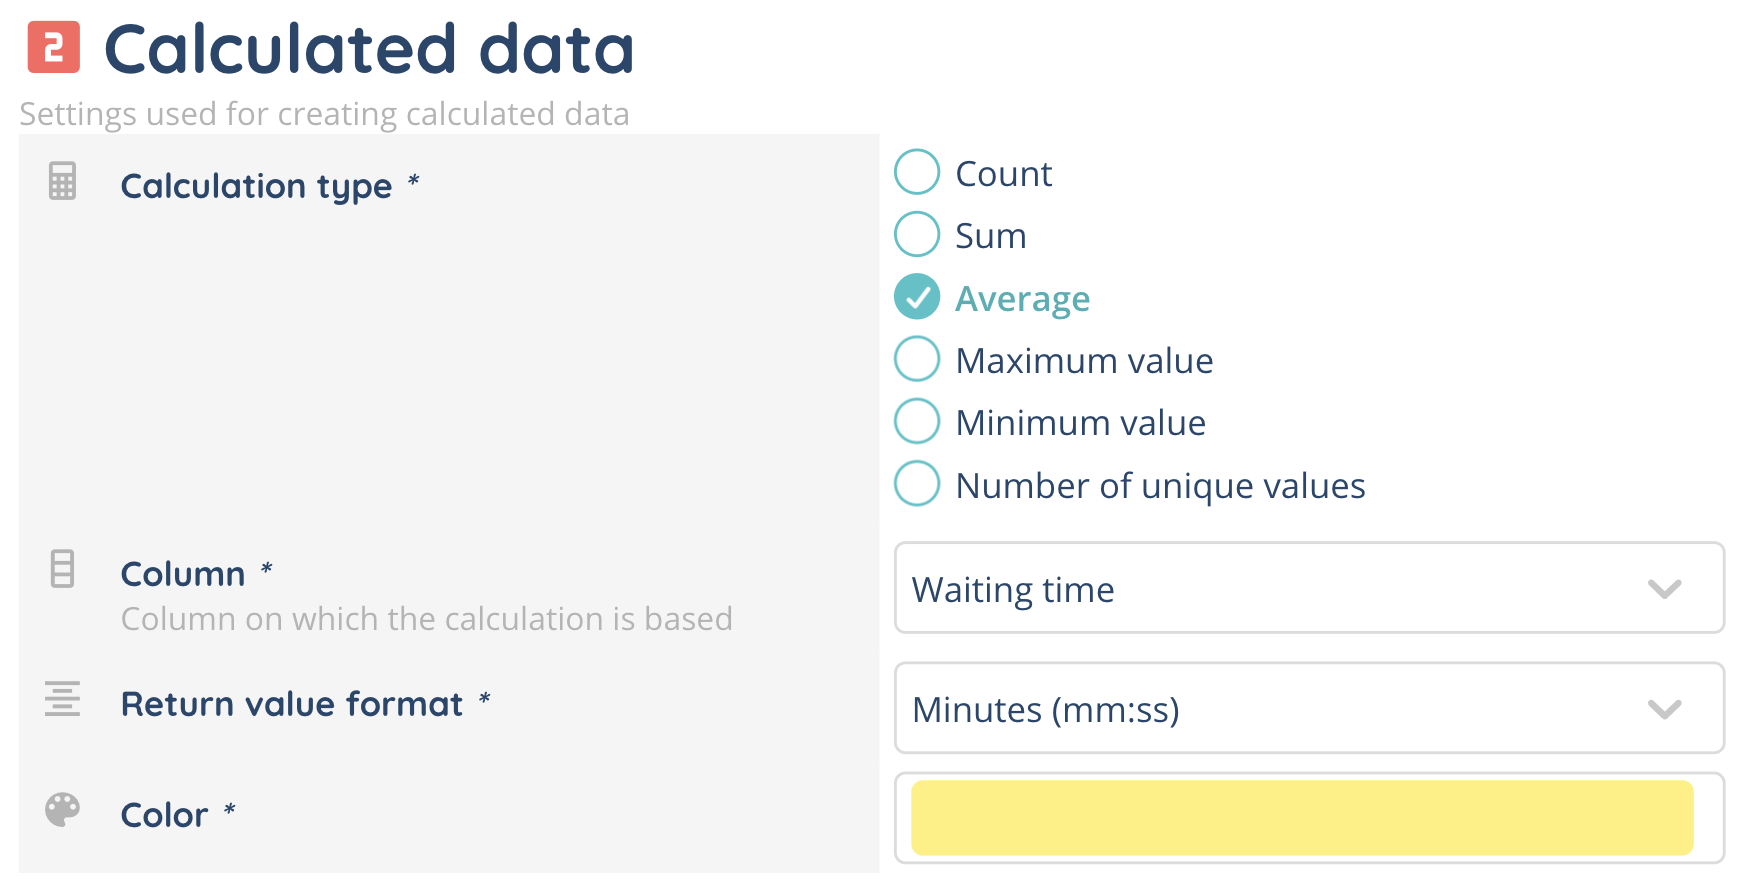
Calculated data
This data type, shown in turquoise in the items table, allows you to perform a simple calculation (sum, average, minimum, maximum, etc.) on a raw data column.
For example, you can calculate the average interaction time by selecting the “Total interaction time” column and applying the “Average” calculation type. Filters can also be applied to restrict the values taken into account in the calculation (based on Maker datas).
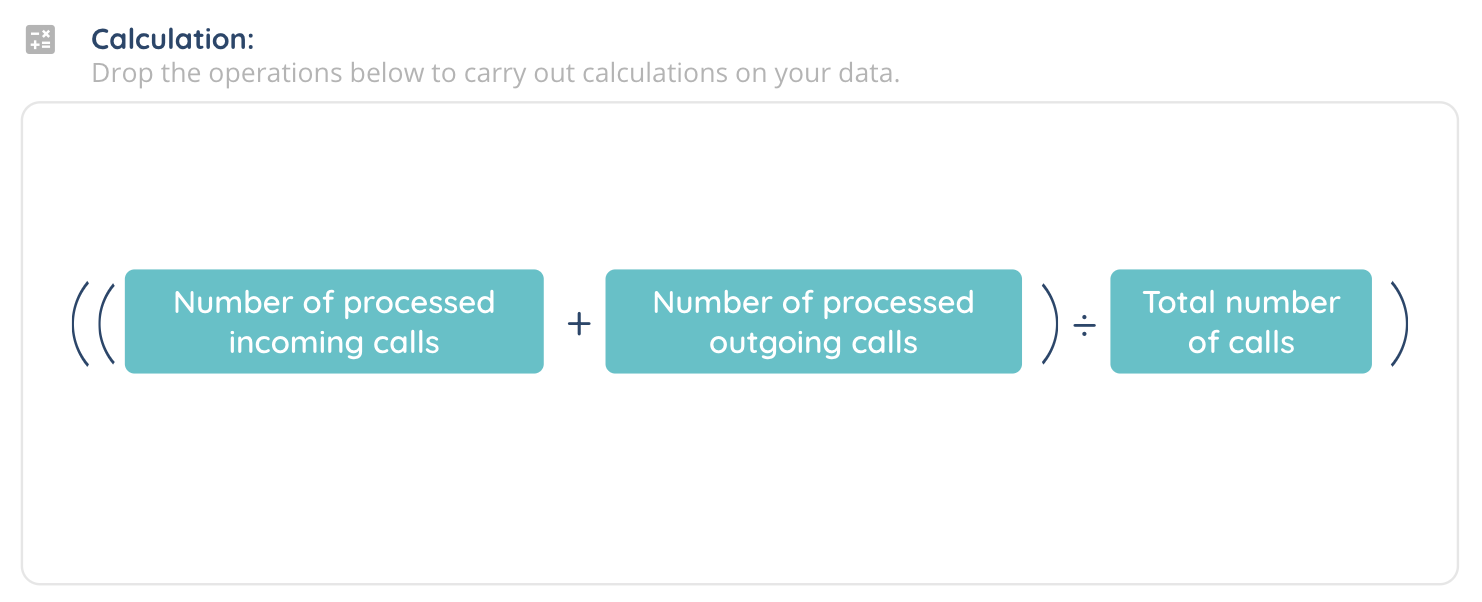
Calculations
This data type, in red in the items table, allows you to create customized formulas from already calculated data.
Simply drag and drop operators (addition, subtraction, multiplication, division) into the ‘Formula’ calculation zone, then add indicators (such as number of calls handled or average waiting time), to obtain a new composite indicator.
Note: A composite indicator is a customized indicator created from several other data items. It can be used to group several measures into a single value to obtain a clearer, more relevant overview.
Choose the data format and color.
This makes it possible to obtain precise data on your interactions.
Note that you can of course use several operators in your calculation.