[Reading time: 2 minutes]
Overview
The Statistics module in the Banner provides a quick summary of interaction activity for the current day. It allows advisors and managers to monitor key performance indicators (KPIs) directly from the Banner, without accessing the Reporter.

For advanced analysis, detailed reports, or custom dashboards, you must use the Reporter module.
1. Prerequisites
To access the Statistics module, the Statistics permission must be set to ON for your active profile.
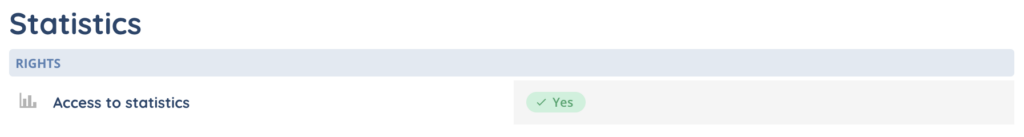
If the permission is not enabled, the module will not be visible in the Banner.
2. Access and display mode
The data displayed depends on the user’s type:
- Advisors can only see their own statistics.
- Managers can see:
- Their own statistics
- The statistics of the team members they manage
- Only for the queues linked to their active profile
By default, the module displays a summary of the current day.
At the top of the module, a drop-down list allows you to choose the activity view:
- Interaction activity per advisor
- Interaction activity per queue
3. Filters
A filter button next to the drop-down list allows you to refine the displayed data.
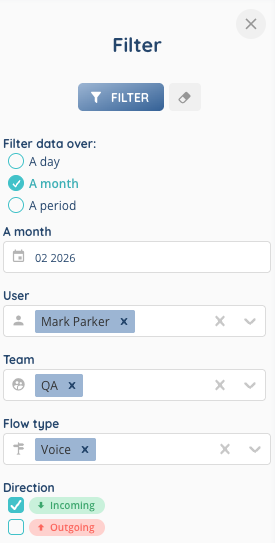
The following filters are available:
- Date filter
- Day
- Month
- Custom period (select one or several days, up to 3 rolling months)
- Users
- Filter on one or multiple users
- Teams
- Filter on one or multiple teams
- Flow type
- Voice
- Messages
- Direction
- Incoming
- Outgoing
The selected filters apply to all KPIs displayed in the module.
4. KPIs
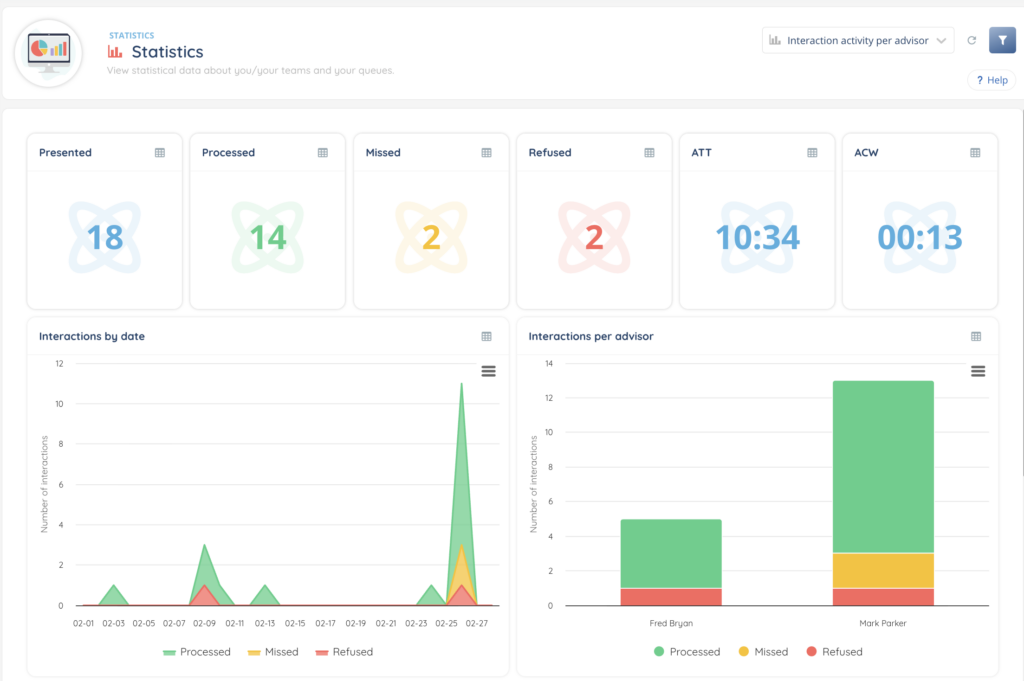
At the top of the module, the following KPIs are displayed:
- Presented
Number of interactions presented to advisors. - Processed
Number of successfully handled interactions. - Missed
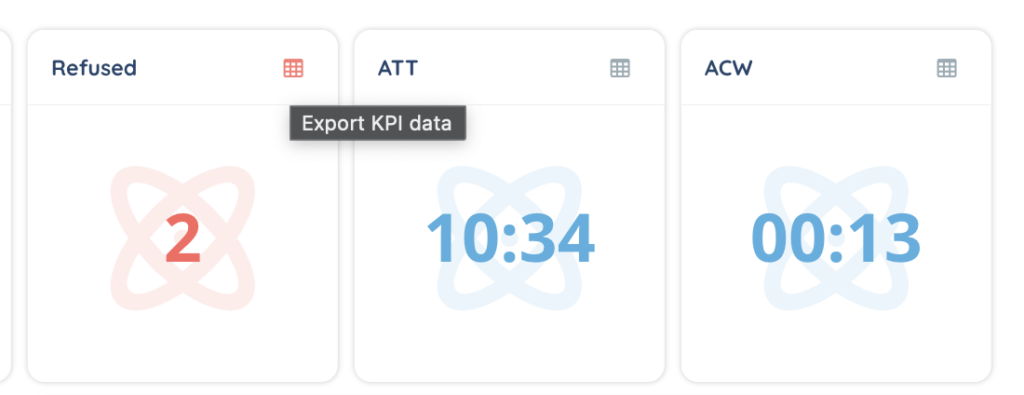
Number of interactions not handled in time. - Refused
Number of interactions actively declined. - ATT (Average Talk Time)
Average duration of conversations. - ACW (After Call Work)
Average time spent in after-interaction processing.
Other KPIs are also displayed:
Interaction by date
Displays the number of interactions:
- Per hour when filtering on a single day
- Per day when filtering on a month or a custom period
The results are displayed with color codes:
- Green: Processed
- Yellow: Missed
- Red: Refused
Interactions per advisor
Displays the number of interactions per advisor, using the same color code:
- Green: Processed
- Yellow: Missed
- Red: Refused
Qualification breakdown
Displays the distribution of responses to the qualifications.
Qualification per advisor
Displays the responses to the qualifications per advisor.
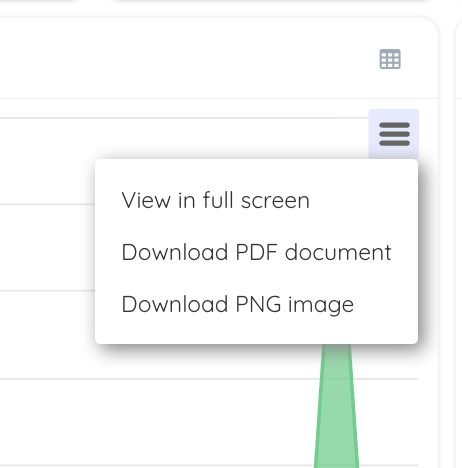
5. Export
Export options are available for each KPI:
- All KPIs can be exported in CSV format.
- The four detailed KPIs (below the main indicators) can also be exported in:
- PNG
- These four KPIs can also be displayed in full screen mode.