
[Reading time: 2 minutes]
OVERVIEW
This functionality allows you to transform customer cases into a data source for generating reports and in-depth analyses. This functionality is designed for supervisors or data analysts.

This feature exploits the information provided by the cases to monitor performance, identify trends and make decisions based on real data.
PREREQUISITES
For an overview of the Reporter, please consult this article.
Cases must have been set up previously, and associated with a layout in the Maker.
Customer cases must have been created via the Banner with profiles using this layout.
USING CASES AS DATA SOURCES
Access this feature
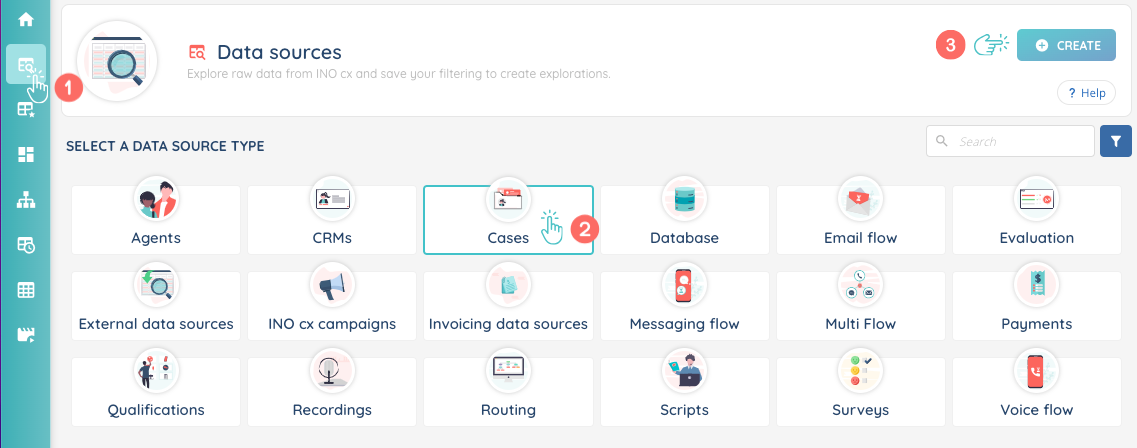
To access this feature, go to the Reporter, click on the ‘Data source’ module and then select the ‘Cases’ source date type.
Create a data export from cases
Click on ‘Create’ to create a data source.
Choose a name, if necessary a description, a type of data source (internal or external), for the origin, select ‘Cases’ and then the layout related to the cases you want to analyse.
Open the data source you have just created, you will now be able to carry out a search.
To do this, select a time period to analyse the cases.
You will immediately see the number of cases for the selected period (‘number of results’).
Note: The selected period cannot exceed 3 months.
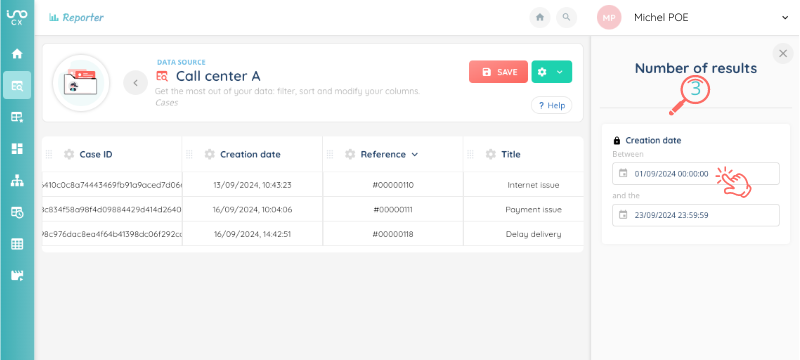
The data is displayed in columns, relating to the fields that have been set up in the layout and additional data provided by the Reporter (case opening time, etc.)
For each column, 3 actions are possible (by clicking on the cogwheel):
- Filter the column
- Modify the column name
- Hide the column
If you wish, you can add one or more columns. To do this, click on the cogwheel at the top right, then ‘add columns’.
You can also change the position of the columns using drag-and-drop.
To start your search from the beginning, you can click on ‘reset’ at the bottom right.
Once the columns you want have been added, you are ready to use the data.
Using the cases data
You have several options:
1) Export the data (on the cogwheel): Export available on the ‘Export’ module for 7 days.
2) Save as an exploration (on the diskette), and select the users who can access it. Note: by default, they will have access in read-only mode. Rights can be changed later if required.
Now you are able to analyse the data using the ‘Export’ module or the ‘Exploration’ module!
COlumns
Here are the details for each column.
- Case ID: the case’s unique ID.
- Creation date: the time and date of the case’s creation.
- Reference
- Title
- Case layout
- Status: New, in progress, on hold, escalated, closed
- Status type: New, in progress, on hold, escalated, closed
- Case closed: Yes/no
- Owner: user’s email
- Opening time
- Number of openings
- Number of closings
- Type
- Reason
- Origin